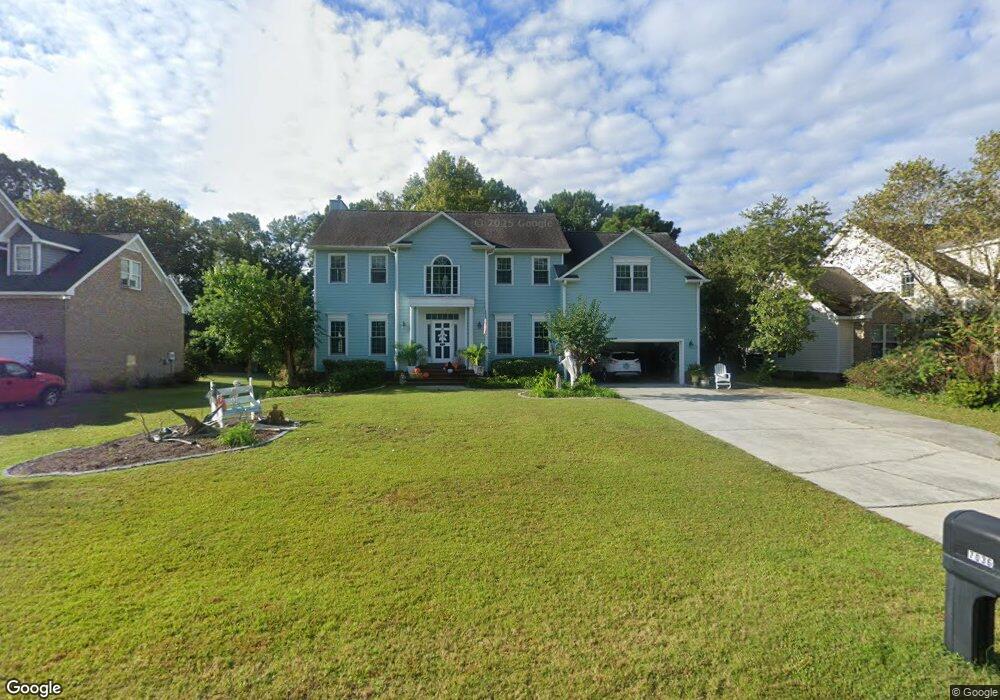
7036 Orchard Trace Wilmington, NC 28409
Masonboro NeighborhoodEstimated Value: $570,000 - $627,000
4
Beds
4
Baths
2,329
Sq Ft
$258/Sq Ft
Est. Value
About This Home
This home is located at 7036 Orchard Trace, Wilmington, NC 28409 and is currently estimated at $601,702, approximately $258 per square foot. 7036 Orchard Trace is a home located in New Hanover County with nearby schools including Masonboro Elementary School, Roland-Grise Middle School, and John T. Hoggard High School.
Ownership History
Date
Name
Owned For
Owner Type
Purchase Details
Closed on
Feb 9, 2001
Sold by
Stevens Donald L Karen B
Bought by
Johnson Larry O Jr Traci M
Current Estimated Value
Purchase Details
Closed on
Feb 24, 2000
Sold by
First National Bank Of Chicago
Bought by
Stevens Donald L Karen B
Purchase Details
Closed on
Dec 20, 1999
Sold by
Mcneely Richard P Sub Tr
Bought by
First National Bank Of Chicago
Purchase Details
Closed on
Feb 6, 1996
Sold by
Youngs Gas & Grocery Of
Bought by
Edge Barry Randolph Myra Joan
Purchase Details
Closed on
Dec 29, 1995
Sold by
Masonboro Land Dev Co
Bought by
Youngs Gas & Grocery Of
Purchase Details
Closed on
Jul 1, 1988
Sold by
Reynolds R F Hrs
Bought by
Masonboro Land Dev Co
Create a Home Valuation Report for This Property
The Home Valuation Report is an in-depth analysis detailing your home's value as well as a comparison with similar homes in the area
Home Values in the Area
Average Home Value in this Area
Purchase History
| Date | Buyer | Sale Price | Title Company |
|---|---|---|---|
| Johnson Larry O Jr Traci M | $190,000 | -- | |
| Stevens Donald L Karen B | $185,000 | -- | |
| First National Bank Of Chicago | $202,000 | -- | |
| Edge Barry Randolph Myra Joan | $25,000 | -- | |
| Youngs Gas & Grocery Of | -- | -- | |
| Masonboro Land Dev Co | $263,500 | -- |
Source: Public Records
Tax History Compared to Growth
Tax History
| Year | Tax Paid | Tax Assessment Tax Assessment Total Assessment is a certain percentage of the fair market value that is determined by local assessors to be the total taxable value of land and additions on the property. | Land | Improvement |
|---|---|---|---|---|
| 2025 | $3,495 | $593,800 | $209,600 | $384,200 |
| 2023 | $3,055 | $351,200 | $124,900 | $226,300 |
| 2022 | $2,985 | $351,200 | $124,900 | $226,300 |
| 2021 | $3,006 | $351,200 | $124,900 | $226,300 |
| 2020 | $3,231 | $306,700 | $90,000 | $216,700 |
| 2019 | $3,231 | $306,700 | $90,000 | $216,700 |
| 2018 | $3,231 | $306,700 | $90,000 | $216,700 |
| 2017 | $3,231 | $306,700 | $90,000 | $216,700 |
| 2016 | $3,279 | $295,900 | $90,000 | $205,900 |
| 2015 | $3,134 | $295,900 | $90,000 | $205,900 |
| 2014 | $3,000 | $295,900 | $90,000 | $205,900 |
Source: Public Records
Map
Nearby Homes
- 3927 Watersail Dr
- 3927 Watersail Dr Unit 93
- 3720 Mason Port Dr Unit 60
- 3146 Painted Turtle Loop
- 3805 Mason Port Dr
- 3817 Mason Port Dr
- 3817 Mason Port Dr Unit 98
- 3160 Painted Turtle Loop Unit 7
- 3164 Painted Turtle Loop Unit 6
- 3164 Painted Turtle Loop
- 3166 Painted Turtle Loop
- 6711 Hardscrabble Ct
- 4041 Watersail Dr
- 4045 Watersail Dr Unit 133
- 4045 Watersail Dr
- 3920 Watersail Dr Unit 87
- 3920 Watersail Dr
- 4249 Watersail Dr
- 4245 Watersail Dr
- 3924 Laurel Point Dr Unit 147
- 7100 Orchard Trace
- 7032 Orchard Trace
- 7104 Orchard Trace
- 7028 Orchard Trace
- 7031 Orchard Trace
- 3118 Painted Turtle Loop Unit 21
- 7103 Orchard Trace
- 3116 Painted Turtle Loop Unit 22
- 7027 Orchard Trace
- 7108 Orchard Trace
- 3122 Painted Turtle Loop Unit 20
- 7024 Orchard Trace
- 7107 Orchard Trace
- 3124 Painted Turtle Loop Unit 19
- 7023 Orchard Trace
- 3128 Painted Turtle Loop
- 3134 Painted Turtle Loop
- 7112 Orchard Trace
- 7111 Orchard Trace
- 7019 Orchard Trace