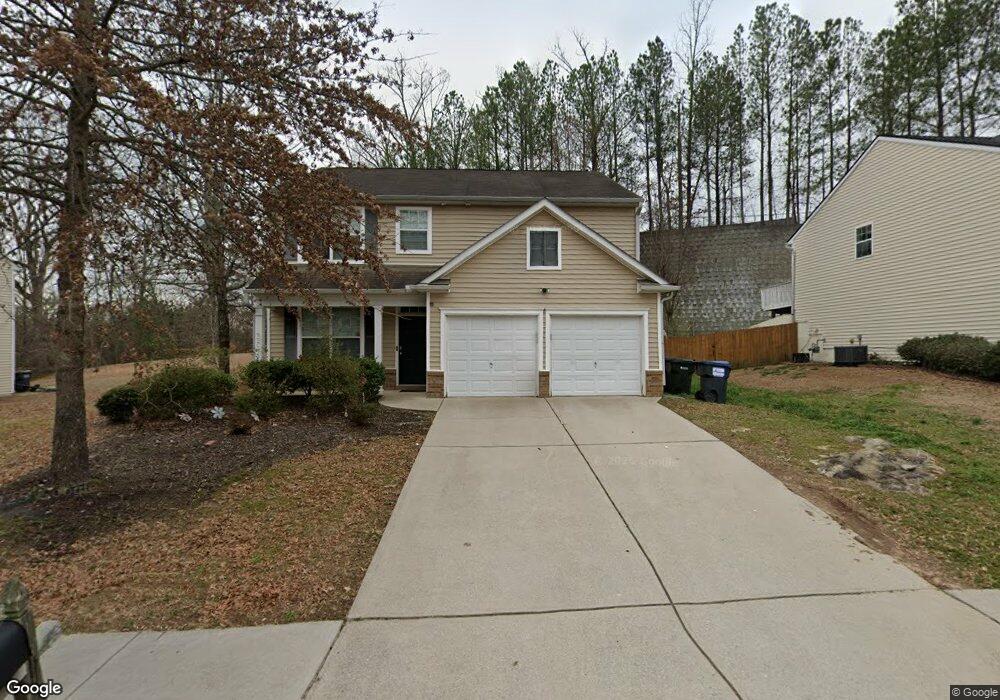
7039 Hillcrest Chase Ln Austell, AZ 30168
Estimated Value: $313,000 - $380,000
4
Beds
3
Baths
2,188
Sq Ft
$160/Sq Ft
Est. Value
About This Home
This home is located at 7039 Hillcrest Chase Ln, Austell, AZ 30168 and is currently estimated at $350,524, approximately $160 per square foot. 7039 Hillcrest Chase Ln is a home located in Cobb County with nearby schools including City View Elementary, Lindley Middle School, and Pebblebrook High School.
Ownership History
Date
Name
Owned For
Owner Type
Purchase Details
Closed on
Oct 19, 2020
Sold by
Progress Atlanta Llc
Bought by
Progress Residential Borrower 15 Llc
Current Estimated Value
Purchase Details
Closed on
Feb 11, 2020
Sold by
Lee Anthony C
Bought by
Progress Atlanta Llc
Purchase Details
Closed on
May 30, 2013
Sold by
Secretary Of Housing And U
Bought by
Lee Anthony C
Home Financials for this Owner
Home Financials are based on the most recent Mortgage that was taken out on this home.
Original Mortgage
$95,230
Interest Rate
3.25%
Mortgage Type
FHA
Purchase Details
Closed on
Nov 6, 2012
Sold by
Georgia Housing And Financ
Bought by
Secretary Of Housing And Urban and Homeown C O Atlanta
Purchase Details
Closed on
Feb 5, 2008
Sold by
Kaira Donaliyn
Bought by
Residential Fndg Co Llc
Create a Home Valuation Report for This Property
The Home Valuation Report is an in-depth analysis detailing your home's value as well as a comparison with similar homes in the area
Home Values in the Area
Average Home Value in this Area
Purchase History
| Date | Buyer | Sale Price | Title Company |
|---|---|---|---|
| Progress Residential Borrower 15 Llc | -- | Select Title Llc | |
| Progress Atlanta Llc | $223,000 | -- | |
| Lee Anthony C | $102,600 | -- | |
| Secretary Of Housing And Urban | -- | -- | |
| Georgia Housing And Finance Au | $129,940 | -- | |
| Residential Fndg Co Llc | $123,250 | -- |
Source: Public Records
Mortgage History
| Date | Status | Borrower | Loan Amount |
|---|---|---|---|
| Previous Owner | Lee Anthony C | $95,230 | |
| Previous Owner | Lee Anthony C | $5,000 |
Source: Public Records
Tax History Compared to Growth
Tax History
| Year | Tax Paid | Tax Assessment Tax Assessment Total Assessment is a certain percentage of the fair market value that is determined by local assessors to be the total taxable value of land and additions on the property. | Land | Improvement |
|---|---|---|---|---|
| 2025 | $4,424 | $146,816 | $28,000 | $118,816 |
| 2024 | $4,427 | $146,816 | $28,000 | $118,816 |
| 2023 | $3,396 | $112,644 | $16,000 | $96,644 |
| 2022 | $3,419 | $112,644 | $16,000 | $96,644 |
| 2021 | $2,682 | $88,384 | $10,800 | $77,584 |
| 2020 | $1,624 | $70,868 | $10,800 | $60,068 |
| 2019 | $1,624 | $70,868 | $10,800 | $60,068 |
| 2018 | $1,531 | $66,588 | $10,800 | $55,788 |
| 2017 | $1,485 | $66,588 | $10,800 | $55,788 |
| 2016 | $1,204 | $53,716 | $8,000 | $45,716 |
| 2015 | $948 | $41,036 | $6,796 | $34,240 |
| 2014 | $956 | $41,036 | $0 | $0 |
Source: Public Records
Map
Nearby Homes
- 338 Alderman Trace
- 218 Copperbend Dr
- 201 Wilhelmina Dr
- 0 Cityview Dr SW Unit 10597603
- 6941 Gallant Cir SE Unit 10
- 6947 Gallant Cir SE Unit 10
- 253 Gallant Cir SE Unit 17
- 7224 Kings Cove Unit 10
- 401 Six Flags Pkwy
- 7080 Fringe Flower Dr Unit 18
- 7066 Oakhill Cir
- 7074 Oakhill Cir
- 295 Sweetshrub Dr Unit 2
- 6726 Gallant Ct SE Unit 30
- 6730 Gallant Ct SE
- 7010 Oakhill Cir
- 6874 Bridgewood Dr
- 6854 Bridgewood Dr
- 6812 Gallant Cir SE Unit 1
- 306 Bonnes Dr
- 7039 Hillcrest Chase Ln
- 7041 Hillcrest Chase Ln
- 7035 Hillcrest Chase Ln Unit 1
- 7165 Silver Mine Crossing Unit 2
- 7043 Hillcrest Chase Ln
- 7038 Hillcrest Chase Ln
- 7083 Hillcrest Chase Ln
- 7083 Hillcrest Chase Ln Unit V
- 7040 Hillcrest Chase Ln
- 7033 Hillcrest Chase Ln Unit 1
- 7166 Silver Mine Crossing Unit 2
- 7163 Silver Mine Crossing Unit 2
- 7163 Silver Mine Crossing Unit OVLK
- 7045 Hillcrest Chase Ln
- 7081 Hillcrest Chase Ln
- 7161 Silver Mine Crossing
- 7164 Silver Mine Crossing
- 7046 Hillcrest Chase Ln Unit 5
- 7029 Hillcrest Chase Ln Unit GAA013
- 7029 Hillcrest Chase Ln