Estimated Value: $273,111 - $287,000
--
Bed
2
Baths
1,862
Sq Ft
$151/Sq Ft
Est. Value
About This Home
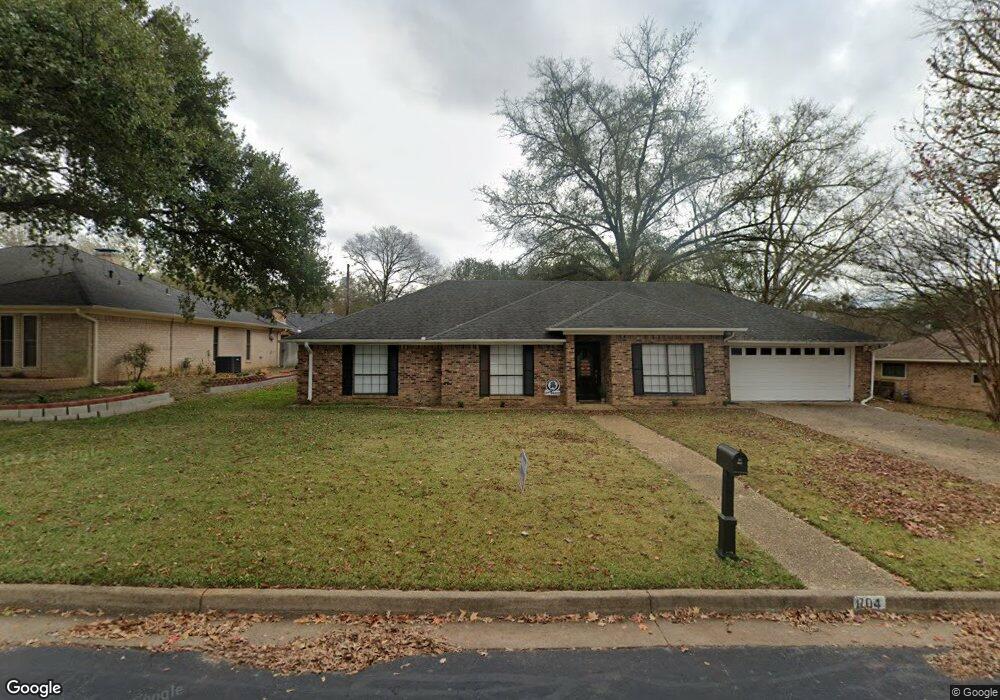
This home is located at 704 Becky Dr, Tyler, TX 75703 and is currently estimated at $281,278, approximately $151 per square foot. 704 Becky Dr is a home located in Smith County with nearby schools including Rice Elementary School, Hubbard Middle School, and Tyler Legacy High School.
Ownership History
Date
Name
Owned For
Owner Type
Purchase Details
Closed on
Mar 11, 2022
Sold by
Cep Properties Llc
Bought by
Clark Allyn S
Current Estimated Value
Home Financials for this Owner
Home Financials are based on the most recent Mortgage that was taken out on this home.
Original Mortgage
$125,000
Outstanding Balance
$115,851
Interest Rate
3.55%
Mortgage Type
New Conventional
Estimated Equity
$165,427
Purchase Details
Closed on
Oct 9, 2019
Sold by
Secretary Of Housing & Urban Developemnt
Bought by
Cep Properties Llc
Home Financials for this Owner
Home Financials are based on the most recent Mortgage that was taken out on this home.
Original Mortgage
$128,000
Interest Rate
3.5%
Mortgage Type
Purchase Money Mortgage
Purchase Details
Closed on
Jan 2, 2019
Sold by
Welch Vernie Marie
Bought by
Department Of Housing & Urban Dev
Create a Home Valuation Report for This Property
The Home Valuation Report is an in-depth analysis detailing your home's value as well as a comparison with similar homes in the area
Home Values in the Area
Average Home Value in this Area
Purchase History
| Date | Buyer | Sale Price | Title Company |
|---|---|---|---|
| Clark Allyn S | -- | Casey H Cross | |
| Cep Properties Llc | $160,000 | None Available | |
| Department Of Housing & Urban Dev | $189,149 | None Available |
Source: Public Records
Mortgage History
| Date | Status | Borrower | Loan Amount |
|---|---|---|---|
| Open | Clark Allyn S | $125,000 | |
| Previous Owner | Cep Properties Llc | $128,000 |
Source: Public Records
Tax History Compared to Growth
Tax History
| Year | Tax Paid | Tax Assessment Tax Assessment Total Assessment is a certain percentage of the fair market value that is determined by local assessors to be the total taxable value of land and additions on the property. | Land | Improvement |
|---|---|---|---|---|
| 2025 | $4,474 | $265,596 | $42,669 | $222,927 |
| 2024 | $4,474 | $263,000 | $37,760 | $225,240 |
| 2023 | $4,471 | $256,503 | $37,760 | $218,743 |
| 2022 | $4,462 | $227,763 | $37,571 | $190,192 |
| 2021 | $4,138 | $197,216 | $37,571 | $159,645 |
| 2020 | $4,220 | $197,216 | $37,571 | $159,645 |
| 2019 | $4,357 | $199,228 | $37,571 | $161,657 |
| 2018 | $3,755 | $172,658 | $18,880 | $153,778 |
| 2017 | $3,806 | $178,283 | $18,880 | $159,403 |
| 2016 | $3,556 | $166,570 | $18,880 | $147,690 |
| 2015 | $3,260 | $160,308 | $18,880 | $141,428 |
| 2014 | $3,260 | $153,413 | $18,880 | $134,533 |
Source: Public Records
Map
Nearby Homes
- 704 Paloma St
- 601 Carriage Dr
- 5106 Cloverdale Dr
- 802 Carriage Dr
- 709 Top Hill Dr
- 842 Carriage Dr
- 608 Top Hill Dr
- 717 Meadow Creek Dr
- 709 W Rieck Rd
- 1107 Larkspur Ln
- 5401 Hollytree Dr
- 5401 Hollytree Dr Unit 1002
- 1202 Rice Rd
- 7434 Waterview Square
- 6052 N Park Central Ct
- 5802 Briar Creek Dr
- 418 Boyd Ln
- 14237 County Road 192
- 14195 County Road 192
- 14245 County Road 192