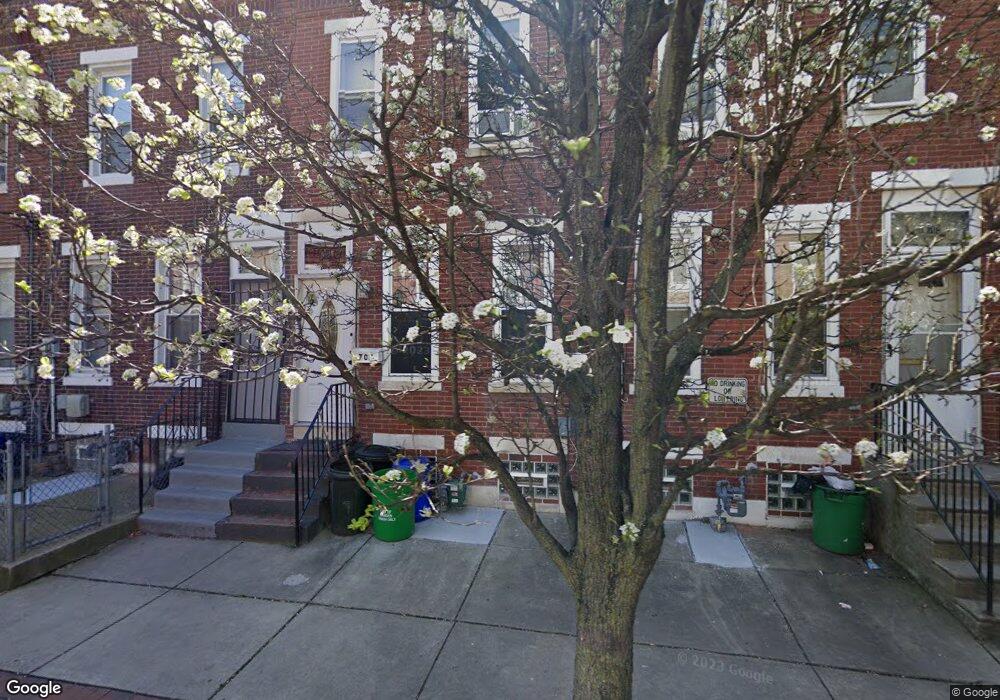
704 Berkley St Camden, NJ 08103
Lanning Square NeighborhoodEstimated Value: $126,035 - $202,000
--
Bed
--
Bath
1,104
Sq Ft
$140/Sq Ft
Est. Value
About This Home
This home is located at 704 Berkley St, Camden, NJ 08103 and is currently estimated at $154,259, approximately $139 per square foot. 704 Berkley St is a home located in Camden County with nearby schools including Camden High School, Hope Community Charter School, and Leap Academy University Charter School.
Ownership History
Date
Name
Owned For
Owner Type
Purchase Details
Closed on
May 18, 2018
Sold by
Wu Le Guo
Bought by
Wu Home Investments Llc
Current Estimated Value
Purchase Details
Closed on
Aug 16, 2013
Sold by
Ccts Tax Liens Llc
Bought by
Father & Son Llc
Purchase Details
Closed on
Oct 1, 2002
Sold by
Chase Manhattan Mortgage Corp
Bought by
Investment Strategies
Purchase Details
Closed on
Aug 29, 1994
Sold by
Neighborhood Housing Svcs
Bought by
Murray Ramona E
Home Financials for this Owner
Home Financials are based on the most recent Mortgage that was taken out on this home.
Original Mortgage
$33,000
Interest Rate
8.44%
Create a Home Valuation Report for This Property
The Home Valuation Report is an in-depth analysis detailing your home's value as well as a comparison with similar homes in the area
Home Values in the Area
Average Home Value in this Area
Purchase History
| Date | Buyer | Sale Price | Title Company |
|---|---|---|---|
| Wu Home Investments Llc | $10,000 | None Available | |
| Father & Son Llc | $35,000 | Surety Title Corp | |
| Investment Strategies | $21,000 | -- | |
| Murray Ramona E | $35,000 | -- |
Source: Public Records
Mortgage History
| Date | Status | Borrower | Loan Amount |
|---|---|---|---|
| Previous Owner | Murray Ramona E | $33,000 |
Source: Public Records
Tax History Compared to Growth
Tax History
| Year | Tax Paid | Tax Assessment Tax Assessment Total Assessment is a certain percentage of the fair market value that is determined by local assessors to be the total taxable value of land and additions on the property. | Land | Improvement |
|---|---|---|---|---|
| 2025 | $1,998 | $56,400 | $6,200 | $50,200 |
| 2024 | $1,932 | $56,400 | $6,200 | $50,200 |
| 2023 | $1,932 | $56,400 | $6,200 | $50,200 |
| 2022 | $1,896 | $56,400 | $6,200 | $50,200 |
| 2021 | $1,889 | $56,400 | $6,200 | $50,200 |
| 2020 | $1,794 | $56,400 | $6,200 | $50,200 |
| 2019 | $1,717 | $56,400 | $6,200 | $50,200 |
| 2018 | $1,708 | $56,400 | $6,200 | $50,200 |
| 2017 | $1,667 | $56,400 | $6,200 | $50,200 |
| 2016 | $1,614 | $56,400 | $6,200 | $50,200 |
| 2015 | $1,553 | $56,400 | $6,200 | $50,200 |
| 2014 | $1,516 | $56,400 | $6,200 | $50,200 |
Source: Public Records
Map
Nearby Homes
- 700 New St Unit 308
- 711 Berkley St
- 601 Berkley St
- 803 Princeton Ave
- 715 S 8th St
- 746 Pine St
- 513 Benson St
- 718 Spruce St
- 724 Spruce St
- 917 S 8th St
- 418 Benson St
- 507 S 4th St
- 321 Washington St
- 918 Mount Ephraim Ave
- 318 Clinton St
- 764 Mount Vernon St
- 1153 Cooper St
- 107 N 6th St
- 449 S 6th St
- 526 Cooper St