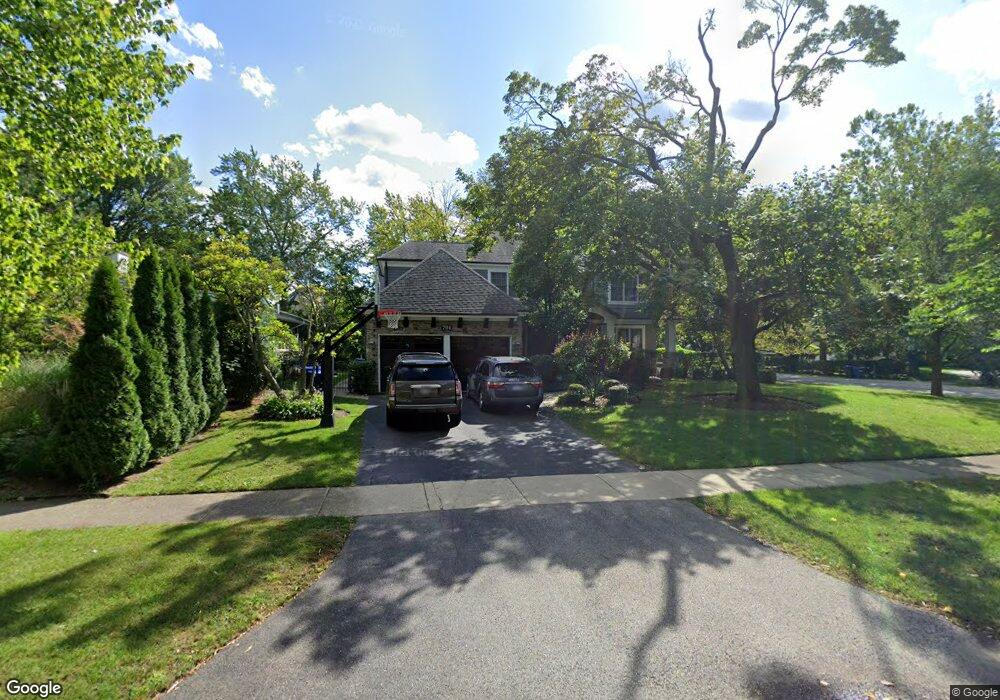
704 Chestnut Ln Glencoe, IL 60022
Estimated Value: $1,466,000 - $2,173,000
4
Beds
5
Baths
4,660
Sq Ft
$400/Sq Ft
Est. Value
About This Home
This home is located at 704 Chestnut Ln, Glencoe, IL 60022 and is currently estimated at $1,863,178, approximately $399 per square foot. 704 Chestnut Ln is a home located in Cook County with nearby schools including South Elementary School, West School, and Central School.
Ownership History
Date
Name
Owned For
Owner Type
Purchase Details
Closed on
Mar 20, 2009
Sold by
Old World Homes Llc
Bought by
Markus Nick A and Economou Sophia D
Current Estimated Value
Home Financials for this Owner
Home Financials are based on the most recent Mortgage that was taken out on this home.
Original Mortgage
$847,500
Outstanding Balance
$531,638
Interest Rate
5.12%
Mortgage Type
Unknown
Estimated Equity
$1,331,540
Purchase Details
Closed on
Jan 6, 2005
Sold by
Kallick Joseph
Bought by
Old World Homes Llc
Home Financials for this Owner
Home Financials are based on the most recent Mortgage that was taken out on this home.
Original Mortgage
$446,250
Interest Rate
5.25%
Mortgage Type
Unknown
Create a Home Valuation Report for This Property
The Home Valuation Report is an in-depth analysis detailing your home's value as well as a comparison with similar homes in the area
Home Values in the Area
Average Home Value in this Area
Purchase History
| Date | Buyer | Sale Price | Title Company |
|---|---|---|---|
| Markus Nick A | $1,130,000 | Attorneys Title Guaranty Fun | |
| Old World Homes Llc | $525,000 | Chicago Title Insurance Comp |
Source: Public Records
Mortgage History
| Date | Status | Borrower | Loan Amount |
|---|---|---|---|
| Open | Markus Nick A | $847,500 | |
| Previous Owner | Old World Homes Llc | $446,250 |
Source: Public Records
Tax History
| Year | Tax Paid | Tax Assessment Tax Assessment Total Assessment is a certain percentage of the fair market value that is determined by local assessors to be the total taxable value of land and additions on the property. | Land | Improvement |
|---|---|---|---|---|
| 2025 | $26,906 | $160,566 | $19,320 | $141,246 |
| 2024 | $26,906 | $95,316 | $18,768 | $76,548 |
| 2023 | $25,095 | $113,156 | $18,768 | $94,388 |
| 2022 | $25,095 | $113,156 | $18,768 | $94,388 |
| 2021 | $23,404 | $84,965 | $18,768 | $66,197 |
| 2020 | $22,786 | $84,965 | $18,768 | $66,197 |
| 2019 | $21,746 | $91,361 | $18,768 | $72,593 |
| 2018 | $21,438 | $84,331 | $15,456 | $68,875 |
| 2017 | $20,827 | $84,331 | $15,456 | $68,875 |
| 2016 | $23,761 | $102,470 | $15,456 | $87,014 |
| 2015 | $20,483 | $78,206 | $12,696 | $65,510 |
| 2014 | $20,477 | $80,161 | $12,696 | $67,465 |
| 2013 | $19,532 | $80,161 | $12,696 | $67,465 |
Source: Public Records
Map
Nearby Homes
- 751 Woodridge Ln
- 808 Prairie Rd
- 780 Prairie Rd
- 1018 Eastwood Rd
- 794 Greenwood Ave
- 476 Park Ave
- 1180 Oak Ridge Dr
- 1125 Elm Ridge Dr
- 491 South Ave
- 1076 Old Elm Ln
- 406 Kelling Ln
- 430 South Ave
- 325 Park Place
- 390 Forest Edge Dr
- 64 Crescent Dr
- 1025 Longaker Rd
- 378 South Ave
- 315 Hawthorn Ave Unit E
- 300 Voltz Rd
- 1112 Whitfield Rd
- 698 Chestnut Ln
- 892 Thornapple Ln
- 690 Chestnut Ln
- 919 Forestway Dr
- 890 Thornapple Ln
- 891 Thornapple Ln
- 926 Forestway Dr
- 920 Forestway Dr
- 925 Forestway Dr
- 700 Woodridge Ln
- 914 Forestway Dr
- 682 Chestnut Ln
- 900 Oak Dr
- 908 Forestway Dr
- 931 Forestway Dr
- 710 Woodridge Ln
- 725 Strawberry Hill Dr
- 908 Oak Dr
- 883 Thornapple Ln
Your Personal Tour Guide
Ask me questions while you tour the home.