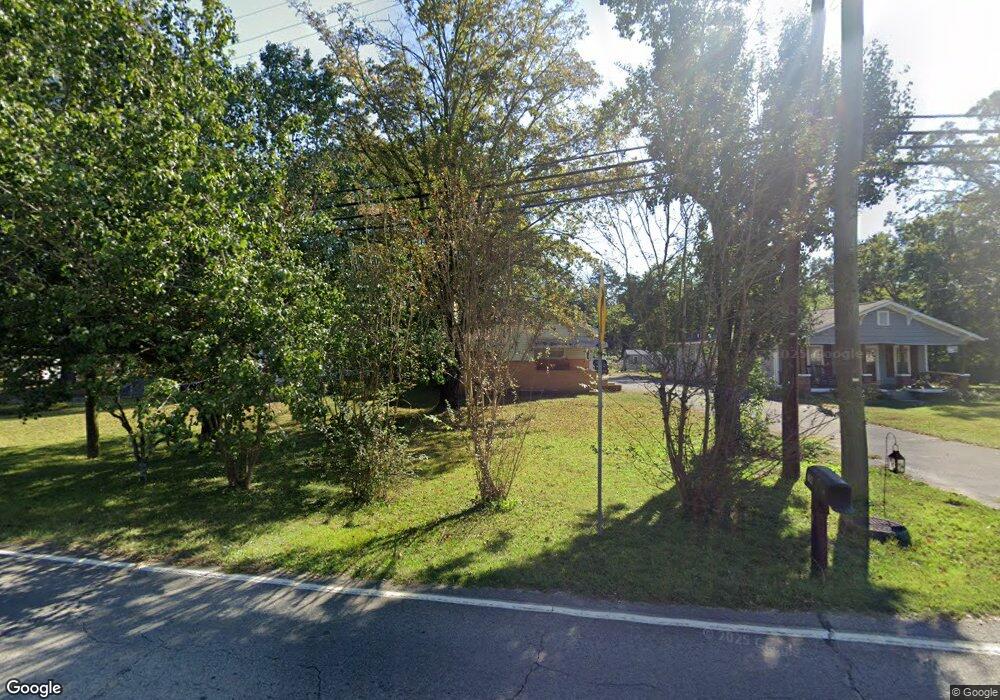
704 Cove Rd Chickamauga, GA 30707
Estimated Value: $192,963 - $241,000
2
Beds
1
Bath
1,275
Sq Ft
$171/Sq Ft
Est. Value
About This Home
This home is located at 704 Cove Rd, Chickamauga, GA 30707 and is currently estimated at $217,491, approximately $170 per square foot. 704 Cove Rd is a home located in Walker County with nearby schools including Chickamauga Elementary School, Gordon Lee Middle School, and Gordon Lee High School.
Ownership History
Date
Name
Owned For
Owner Type
Purchase Details
Closed on
Aug 13, 2024
Sold by
Meroney Gloria
Bought by
Brown Valera Elizabeth
Current Estimated Value
Purchase Details
Closed on
Nov 21, 2016
Sold by
Gloria
Bought by
Meroney Gloria and Brown Valera Elizabeth
Purchase Details
Closed on
Nov 17, 2004
Sold by
Ellis Billy N
Bought by
Meroney Robert A
Purchase Details
Closed on
Jun 24, 2004
Sold by
Kimsey Edna Jean
Bought by
Ellis Billy N
Purchase Details
Closed on
Jun 3, 2003
Sold by
Anderson Michael Frank
Bought by
Kimsey Edna Jean
Purchase Details
Closed on
May 9, 2003
Sold by
Anderson Michael Frank
Bought by
Anderson Michael Frank
Purchase Details
Closed on
Mar 28, 2001
Sold by
Mullis Albert
Bought by
Anderson Michael Frank
Purchase Details
Closed on
Jan 1, 1972
Bought by
Mullis Albert
Create a Home Valuation Report for This Property
The Home Valuation Report is an in-depth analysis detailing your home's value as well as a comparison with similar homes in the area
Home Values in the Area
Average Home Value in this Area
Purchase History
| Date | Buyer | Sale Price | Title Company |
|---|---|---|---|
| Brown Valera Elizabeth | -- | -- | |
| Meroney Gloria | -- | -- | |
| Meroney Gloria | -- | -- | |
| Meroney Robert A | $90,000 | -- | |
| Ellis Billy N | $73,000 | -- | |
| Kimsey Edna Jean | -- | -- | |
| Anderson Michael Frank | -- | -- | |
| Anderson Michael Frank | $78,500 | -- | |
| Mullis Albert | -- | -- |
Source: Public Records
Tax History
| Year | Tax Paid | Tax Assessment Tax Assessment Total Assessment is a certain percentage of the fair market value that is determined by local assessors to be the total taxable value of land and additions on the property. | Land | Improvement |
|---|---|---|---|---|
| 2025 | $1,363 | $57,976 | $10,325 | $47,651 |
| 2024 | $1,409 | $58,473 | $8,784 | $49,689 |
| 2023 | $1,328 | $53,104 | $5,856 | $47,248 |
| 2022 | $488 | $36,255 | $5,856 | $30,399 |
| 2021 | $432 | $25,407 | $3,660 | $21,747 |
| 2020 | $445 | $23,858 | $3,660 | $20,198 |
| 2019 | $444 | $23,858 | $3,660 | $20,198 |
| 2018 | $313 | $23,858 | $3,660 | $20,198 |
| 2017 | $313 | $23,858 | $3,660 | $20,198 |
| 2016 | $347 | $23,858 | $3,660 | $20,198 |
| 2015 | $501 | $36,266 | $4,500 | $31,766 |
| 2014 | $399 | $36,266 | $4,500 | $31,766 |
| 2013 | -- | $36,266 | $4,500 | $31,766 |
Source: Public Records
Map
Nearby Homes
- 1527 Glass Mill Rd
- 145 Sherry Ct
- 110 Christopher Dr
- 409 Elder Ave
- 0 W 12th St Unit 1526508
- 311 Crescent Ave
- 308 Pinehurst Cir
- 260 E Tennant Cir
- 201 E Tennant Cir
- 43 Hidden Hills Dr
- 16 Euclid Ave
- 74 Cove Rd
- 80 Cove Rd
- 327 Starr Hawk Ln
- 111 Clebourne Ave
- 130 Krystal Dr
- 0 Cheatham Ave Unit 1529843
- 8 W 8th St
- 17 W Fork Ln
- 1011 Grand Center Rd
Your Personal Tour Guide
Ask me questions while you tour the home.