Estimated Value: $153,449 - $250,000
3
Beds
2
Baths
1,272
Sq Ft
$143/Sq Ft
Est. Value
About This Home
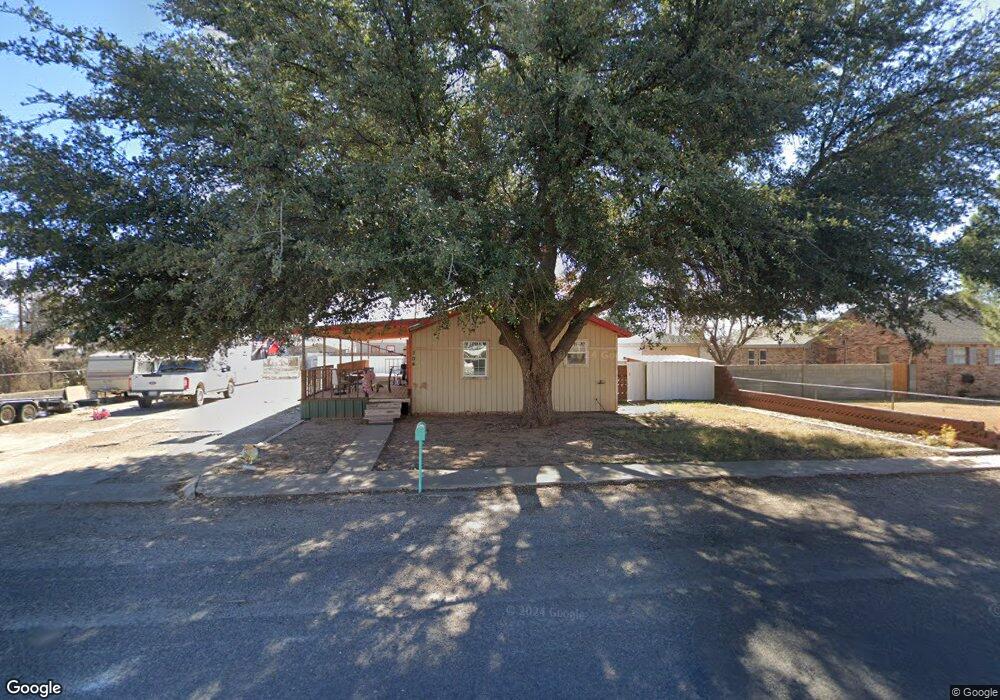
This home is located at 704 E 21st St, Crane, TX 79731 and is currently estimated at $182,362, approximately $143 per square foot. 704 E 21st St is a home located in Crane County with nearby schools including Crane Elementary School, Crane Middle School, and Crane High School.
Ownership History
Date
Name
Owned For
Owner Type
Purchase Details
Closed on
Jun 28, 2018
Sold by
Sutherland Tyler Blayne
Bought by
Hawkes Krystle Rose
Current Estimated Value
Purchase Details
Closed on
Jun 21, 2016
Sold by
Sutherland Billy Don
Bought by
Sutherland Tyler Blayne
Purchase Details
Closed on
Jul 14, 2006
Sold by
Swartz & Brough Inc
Bought by
Sills Damon and Sills Angelia
Home Financials for this Owner
Home Financials are based on the most recent Mortgage that was taken out on this home.
Original Mortgage
$34,200
Interest Rate
6.66%
Mortgage Type
Purchase Money Mortgage
Create a Home Valuation Report for This Property
The Home Valuation Report is an in-depth analysis detailing your home's value as well as a comparison with similar homes in the area
Home Values in the Area
Average Home Value in this Area
Purchase History
| Date | Buyer | Sale Price | Title Company |
|---|---|---|---|
| Hawkes Krystle Rose | -- | None Available | |
| Sutherland Tyler Blayne | -- | None Available | |
| Sills Damon | -- | -- |
Source: Public Records
Mortgage History
| Date | Status | Borrower | Loan Amount |
|---|---|---|---|
| Previous Owner | Sills Damon | $34,200 |
Source: Public Records
Tax History
| Year | Tax Paid | Tax Assessment Tax Assessment Total Assessment is a certain percentage of the fair market value that is determined by local assessors to be the total taxable value of land and additions on the property. | Land | Improvement |
|---|---|---|---|---|
| 2025 | $1,971 | $78,390 | $5,500 | $72,890 |
| 2024 | $1,874 | $78,390 | $5,500 | $72,890 |
| 2023 | $1,307 | $59,090 | $5,500 | $53,590 |
| 2022 | $1,398 | $59,090 | $5,500 | $53,590 |
| 2021 | $1,365 | $51,970 | $5,500 | $46,470 |
| 2020 | $1,334 | $49,190 | $5,500 | $43,690 |
| 2019 | $1,493 | $49,190 | $5,500 | $43,690 |
| 2018 | $1,516 | $49,190 | $5,500 | $43,690 |
| 2017 | $1,783 | $57,850 | $5,500 | $52,350 |
| 2015 | -- | $51,530 | $5,500 | $46,030 |
| 2014 | -- | $36,400 | $5,500 | $30,900 |
Source: Public Records
Map
Nearby Homes
- 710 E 21st St
- 621 E 20th St
- 711 E 24th St
- 1607 S Mcelroy St
- 104 Cardonna Dr
- 1407 S Mcelroy St
- 00 Hwy 385s
- 1208 S Mary St
- 1204 S Mary St
- 1126 S Katherine St
- 1110 S Elizabeth St
- 403 S Sue St
- 816 W 9th St
- 200 S Mcelroy St
- 208 S Vivian St
- 101 S Sue St
- 1000 W 1st St
- 0 County Road 410 Unit 11606092
- Lot 19 Bass St
- Lot 16 Bass St
Your Personal Tour Guide
Ask me questions while you tour the home.