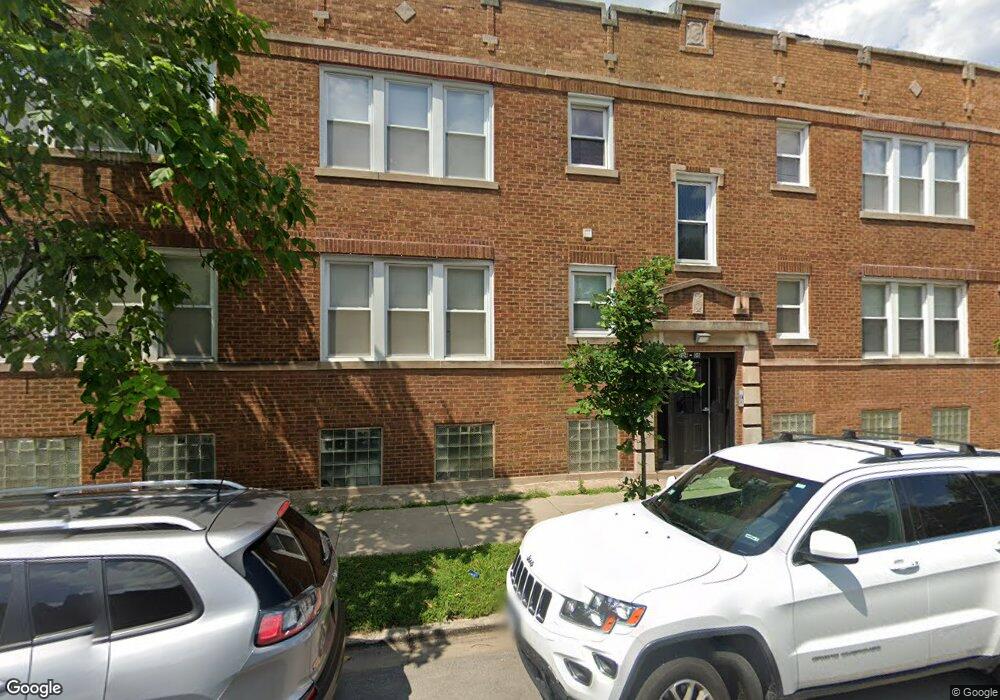
704 E 76th St Chicago, IL 60619
Park Manor Neighborhood
--
Bed
--
Bath
--
Sq Ft
--
Built
About This Home
Tenant pays own utility
Central A/C and Heating. Stainless Steel Appliances
Create a Home Valuation Report for This Property
The Home Valuation Report is an in-depth analysis detailing your home's value as well as a comparison with similar homes in the area
Home Values in the Area
Average Home Value in this Area
Property History
We collect this data history from publicly available records. To have your information removed, we recommend requesting removal directly through your county’s website.
| Date | Event | Price | List to Sale | Price per Sq Ft |
|---|---|---|---|---|
| 02/10/2025 02/10/25 | Off Market | -- | -- | -- |
| 01/08/2025 01/08/25 | For Rent | -- | -- | -- |
Tax History
We collect this data history from publicly available records. To have your information removed, we recommend requesting removal directly through your county’s website.
| Year | Tax Paid | Tax Assessment Tax Assessment Total Assessment is a certain percentage of the fair market value that is determined by local assessors to be the total taxable value of land and additions on the property. | Land | Improvement |
|---|---|---|---|---|
| 2025 | $3,587 | $22,800 | $2,869 | $19,931 |
| 2024 | $3,587 | $22,800 | $2,869 | $19,931 |
| 2023 | $3,497 | $17,000 | $3,985 | $13,015 |
| 2022 | $3,497 | $17,000 | $3,985 | $13,015 |
| 2021 | $3,419 | $17,000 | $3,985 | $13,015 |
| 2020 | $3,683 | $16,532 | $3,985 | $12,547 |
| 2019 | $3,775 | $18,787 | $3,985 | $14,802 |
| 2018 | $3,711 | $18,787 | $3,985 | $14,802 |
| 2017 | $4,786 | $22,231 | $3,506 | $18,725 |
| 2016 | $4,453 | $22,231 | $3,506 | $18,725 |
| 2015 | $4,074 | $22,231 | $3,506 | $18,725 |
| 2014 | $3,929 | $21,177 | $2,869 | $18,308 |
| 2013 | $3,373 | $21,177 | $2,869 | $18,308 |
Source: Public Records
Map
Nearby Homes
- 7512 S Langley Ave
- 7459 S Champlain Ave
- 1418 E 76th St
- 7535 S Saint Lawrence Ave
- 7537 S Saint Lawrence Ave
- 7436 S Langley Ave
- 7630 S Champlain Ave
- 7438 S Champlain Ave
- 7512 S Saint Lawrence Ave
- 7417 S Langley Ave
- 7614 S Maryland Ave
- 7415 S Langley Ave
- 7410 S Langley Ave
- 7545 S Rhodes Ave
- 7431 S Saint Lawrence Ave
- 7601 S Rhodes Ave
- 7653 S Saint Lawrence Ave
- 7629 S Maryland Ave
- 7514 S Rhodes Ave
- 7405 S Saint Lawrence Ave
- 7541 S Langley Ave
- 7541 S Langley Ave Unit Basement
- 7543 S Langley Ave
- 7537 S Langley Ave
- 7537 S Langley Ave Unit 1
- 7537 S Langley Ave
- 7533 S Langley Ave
- 7547 S Langley Ave
- 7549 S Langley Ave
- 7549 S Langley Ave Unit 1
- 7531 S Langley Ave
- 7529 S Langley Ave
- 7529 S Langley Ave Unit 2
- 7551 S Langley Ave
- 7555 S Langley Ave
- 7525 S Langley Ave
- 7525 S Langley Ave
- 7538 S Langley Ave
- 7532 S Langley Ave
- 7536 S Evans Ave
Your Personal Tour Guide
Ask me questions while you tour the home.