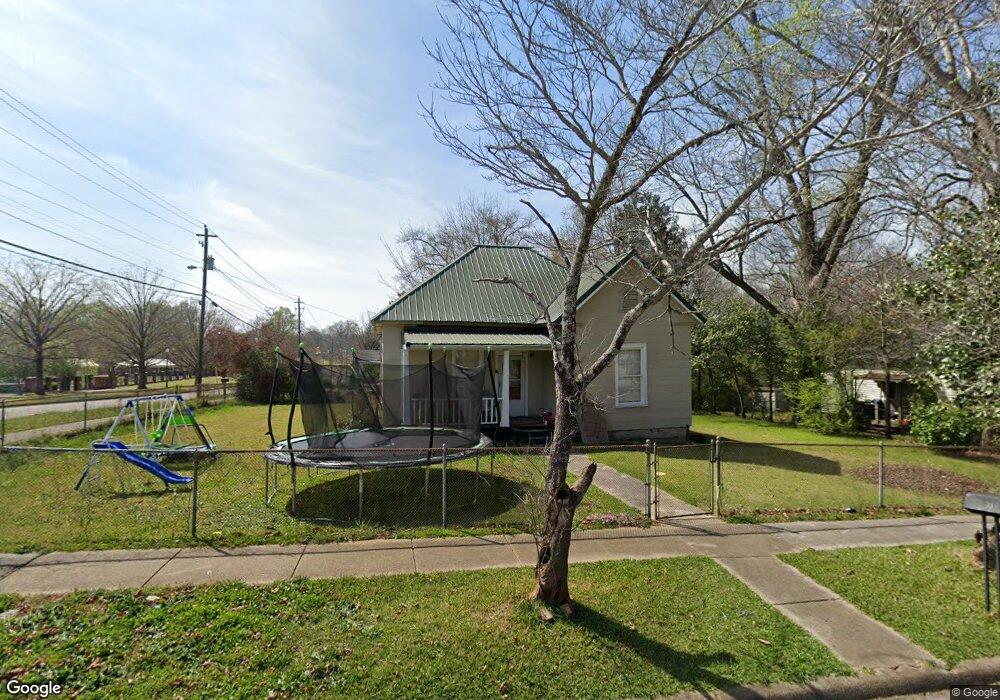
704 Elm St Lagrange, GA 30240
Estimated Value: $88,000 - $125,000
2
Beds
1
Bath
1,176
Sq Ft
$86/Sq Ft
Est. Value
About This Home
This home is located at 704 Elm St, Lagrange, GA 30240 and is currently estimated at $100,877, approximately $85 per square foot. 704 Elm St is a home located in Troup County with nearby schools including Ethel W. Kight Elementary School, Hollis Hand Elementary School, and Franklin Forest Elementary School.
Ownership History
Date
Name
Owned For
Owner Type
Purchase Details
Closed on
Nov 30, 2018
Sold by
Guined Francine J
Bought by
Mimet Llc
Current Estimated Value
Home Financials for this Owner
Home Financials are based on the most recent Mortgage that was taken out on this home.
Original Mortgage
$106,500
Outstanding Balance
$77,923
Interest Rate
4.8%
Mortgage Type
Commercial
Estimated Equity
$22,954
Purchase Details
Closed on
Oct 24, 2013
Sold by
Jeffords Janet Francine
Bought by
Guined Francine J and Guined Charles T
Purchase Details
Closed on
Jun 25, 2004
Sold by
Russell G Taylor
Bought by
Crites James E and Crites Francine J
Purchase Details
Closed on
Aug 28, 2000
Sold by
Exec Deed For Huey F Shellnut
Bought by
Russell G Taylor
Purchase Details
Closed on
Dec 16, 1972
Sold by
Shelnutt Eskew M
Bought by
Exec Deed For Huey F Shellnut
Purchase Details
Closed on
May 1, 1950
Sold by
Callaway Community Fdn
Bought by
Shelnutt Eskew M
Create a Home Valuation Report for This Property
The Home Valuation Report is an in-depth analysis detailing your home's value as well as a comparison with similar homes in the area
Purchase History
| Date | Buyer | Sale Price | Title Company |
|---|---|---|---|
| Mimet Llc | $142,000 | -- | |
| Guined Francine J | -- | -- | |
| Crites James E | $39,000 | -- | |
| Russell G Taylor | $19,500 | -- | |
| Exec Deed For Huey F Shellnut | $7,000 | -- | |
| Shelnutt Eskew M | -- | -- |
Source: Public Records
Mortgage History
| Date | Status | Borrower | Loan Amount |
|---|---|---|---|
| Open | Mimet Llc | $106,500 |
Source: Public Records
Tax History
| Year | Tax Paid | Tax Assessment Tax Assessment Total Assessment is a certain percentage of the fair market value that is determined by local assessors to be the total taxable value of land and additions on the property. | Land | Improvement |
|---|---|---|---|---|
| 2025 | $754 | $27,640 | $4,080 | $23,560 |
| 2024 | $628 | $23,040 | $4,080 | $18,960 |
| 2023 | $603 | $22,120 | $4,080 | $18,040 |
| 2022 | $589 | $21,120 | $4,080 | $17,040 |
| 2021 | $474 | $15,720 | $4,080 | $11,640 |
| 2020 | $474 | $15,720 | $4,080 | $11,640 |
| 2019 | $445 | $14,880 | $4,080 | $10,800 |
| 2018 | $453 | $15,020 | $4,220 | $10,800 |
| 2017 | $453 | $15,020 | $4,220 | $10,800 |
| 2016 | $450 | $14,914 | $4,220 | $10,694 |
| 2015 | $451 | $14,914 | $4,220 | $10,694 |
| 2014 | $498 | $16,469 | $4,220 | $12,249 |
| 2013 | -- | $17,591 | $4,220 | $13,371 |
Source: Public Records
Map
Nearby Homes
Your Personal Tour Guide
Ask me questions while you tour the home.