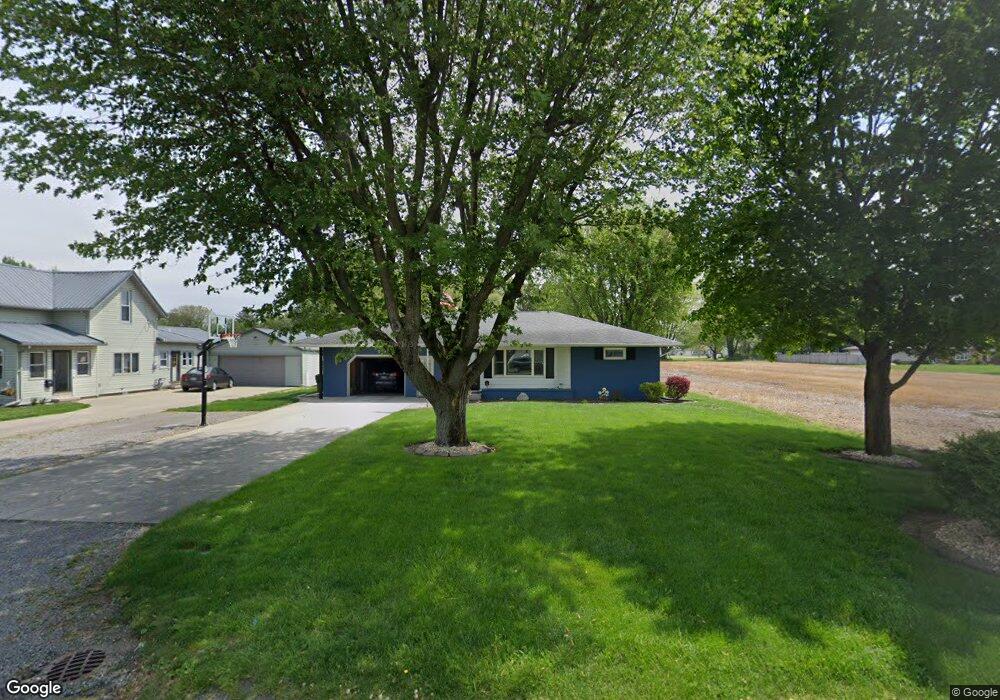
704 Hudson St Delphos, OH 45833
Estimated Value: $141,000 - $166,193
3
Beds
1
Bath
1,352
Sq Ft
$118/Sq Ft
Est. Value
About This Home
This home is located at 704 Hudson St, Delphos, OH 45833 and is currently estimated at $159,548, approximately $118 per square foot. 704 Hudson St is a home located in Van Wert County with nearby schools including Delphos St. John's High School and Delphos St. John's Elementary School.
Ownership History
Date
Name
Owned For
Owner Type
Purchase Details
Closed on
Oct 20, 2010
Sold by
Hartman Luke E and Hartman Lindsay N
Bought by
Rode Cory R and Rode Brenda S
Current Estimated Value
Home Financials for this Owner
Home Financials are based on the most recent Mortgage that was taken out on this home.
Original Mortgage
$75,510
Outstanding Balance
$49,506
Interest Rate
4.3%
Mortgage Type
New Conventional
Estimated Equity
$110,042
Purchase Details
Closed on
Apr 26, 2006
Sold by
Us Bank Na
Bought by
Hartman Luke E and Hartman Lindsay N
Home Financials for this Owner
Home Financials are based on the most recent Mortgage that was taken out on this home.
Original Mortgage
$66,175
Interest Rate
6.39%
Mortgage Type
New Conventional
Purchase Details
Closed on
Feb 21, 2006
Sold by
Ditto James S
Bought by
Us Bank National Association Nd
Purchase Details
Closed on
Apr 28, 2004
Bought by
Hartman Luke E and Hartman Lindsay
Create a Home Valuation Report for This Property
The Home Valuation Report is an in-depth analysis detailing your home's value as well as a comparison with similar homes in the area
Home Values in the Area
Average Home Value in this Area
Purchase History
| Date | Buyer | Sale Price | Title Company |
|---|---|---|---|
| Rode Cory R | $83,900 | Attorney | |
| Hartman Luke E | $96,000 | None Available | |
| Us Bank National Association Nd | -- | None Available | |
| Hartman Luke E | $69,000 | -- | |
| Hartman Luke E | $69,000 | -- |
Source: Public Records
Mortgage History
| Date | Status | Borrower | Loan Amount |
|---|---|---|---|
| Open | Rode Cory R | $75,510 | |
| Closed | Hartman Luke E | $66,175 |
Source: Public Records
Tax History Compared to Growth
Tax History
| Year | Tax Paid | Tax Assessment Tax Assessment Total Assessment is a certain percentage of the fair market value that is determined by local assessors to be the total taxable value of land and additions on the property. | Land | Improvement |
|---|---|---|---|---|
| 2024 | $1,339 | $47,590 | $5,240 | $42,350 |
| 2023 | $1,339 | $47,590 | $5,240 | $42,350 |
| 2022 | $1,070 | $34,650 | $4,150 | $30,500 |
| 2021 | $1,073 | $34,650 | $4,150 | $30,500 |
| 2020 | $1,103 | $34,650 | $4,150 | $30,500 |
| 2019 | $893 | $31,150 | $4,150 | $27,000 |
| 2018 | $898 | $31,150 | $4,150 | $27,000 |
| 2017 | $900 | $31,150 | $4,150 | $27,000 |
| 2016 | $762 | $26,810 | $4,150 | $22,660 |
| 2015 | $761 | $26,810 | $4,150 | $22,660 |
| 2014 | $799 | $26,810 | $4,150 | $22,660 |
| 2013 | $852 | $26,810 | $4,150 | $22,660 |
Source: Public Records
Map
Nearby Homes
- 634 S Clay St
- 424 S Canal St
- 516 S Main St
- 827 S Washington St
- 221 S Main St
- 483 S Franklin St
- 1400 S Clay St Unit 17
- 409 N Bredeick St
- 210 E 3rd St
- 405 N Franklin St
- 604 W 6th St
- 633 E 2nd St
- 610 N Washington St
- 704 N Franklin St
- 810 N Franklin St
- 11630 Clearview Dr
- 521 Carolyn Dr
- 7110 Elida Rd
- 1303 Carolyn Dr
- 1220 Rose Anna Dr