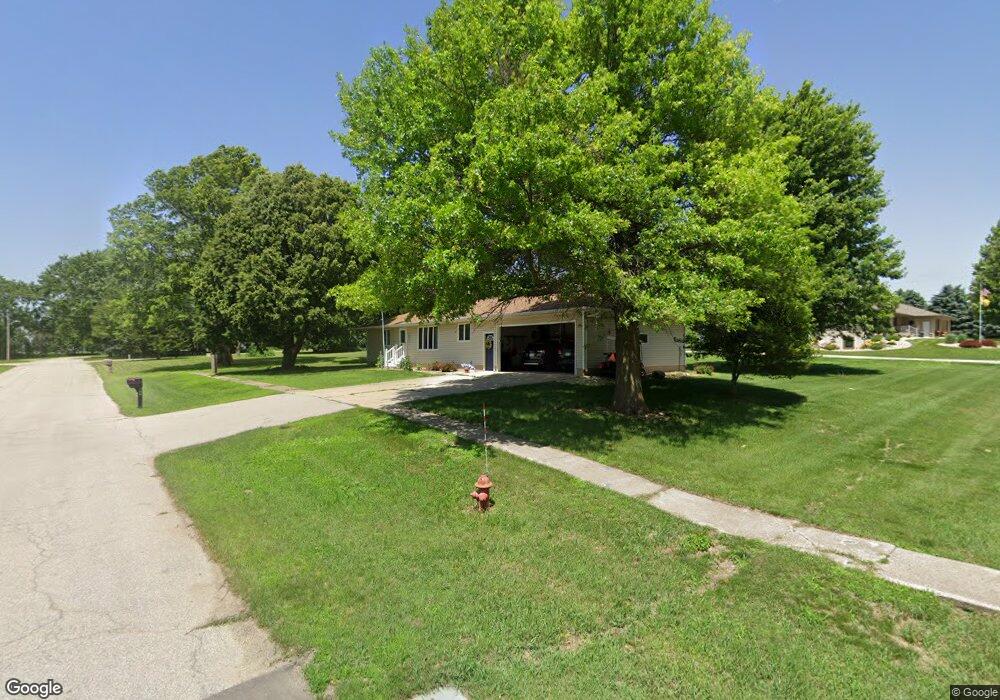
704 Maple St Thornton, IA 50479
Estimated Value: $160,000 - $187,019
2
Beds
2
Baths
1,344
Sq Ft
$132/Sq Ft
Est. Value
About This Home
This home is located at 704 Maple St, Thornton, IA 50479 and is currently estimated at $177,255, approximately $131 per square foot. 704 Maple St is a home located in Cerro Gordo County with nearby schools including West Fork High School.
Ownership History
Date
Name
Owned For
Owner Type
Purchase Details
Closed on
Aug 25, 2020
Sold by
Nelson Mark D and Nelson Melissa A
Bought by
Stark Russell T and Stark Jannel L
Current Estimated Value
Purchase Details
Closed on
Jan 6, 2015
Sold by
Nelson Mark D and Nelson Melissa A
Bought by
Nelson Mark D and Nelson Melissa A
Purchase Details
Closed on
Jun 1, 2005
Sold by
Strickler James H and Strickler Ann P
Bought by
Nelson Mark D
Home Financials for this Owner
Home Financials are based on the most recent Mortgage that was taken out on this home.
Original Mortgage
$83,200
Interest Rate
5.91%
Mortgage Type
New Conventional
Create a Home Valuation Report for This Property
The Home Valuation Report is an in-depth analysis detailing your home's value as well as a comparison with similar homes in the area
Purchase History
| Date | Buyer | Sale Price | Title Company |
|---|---|---|---|
| Stark Russell T | $135,000 | None Available | |
| Nelson Mark D | -- | None Available | |
| Nelson Mark D | $104,000 | -- | |
| Nelson Mark D | $104,000 | None Available |
Source: Public Records
Mortgage History
| Date | Status | Borrower | Loan Amount |
|---|---|---|---|
| Previous Owner | Nelson Mark D | $83,200 |
Source: Public Records
Tax History
| Year | Tax Paid | Tax Assessment Tax Assessment Total Assessment is a certain percentage of the fair market value that is determined by local assessors to be the total taxable value of land and additions on the property. | Land | Improvement |
|---|---|---|---|---|
| 2025 | $1,836 | $172,800 | $16,500 | $156,300 |
| 2024 | $1,836 | $153,820 | $16,500 | $137,320 |
| 2023 | $1,948 | $153,820 | $16,500 | $137,320 |
| 2022 | $1,736 | $128,210 | $13,200 | $115,010 |
| 2021 | $1,970 | $116,530 | $13,200 | $103,330 |
| 2020 | $1,970 | $113,700 | $11,880 | $101,820 |
| 2019 | $1,998 | $0 | $0 | $0 |
| 2018 | $1,698 | $0 | $0 | $0 |
| 2017 | $1,732 | $0 | $0 | $0 |
| 2016 | $1,648 | $0 | $0 | $0 |
| 2015 | $1,648 | $0 | $0 | $0 |
| 2014 | $1,774 | $0 | $0 | $0 |
| 2013 | $1,666 | $0 | $0 | $0 |
Source: Public Records
Map
Nearby Homes
- 400 N 4th St
- 9213 160th St
- 940 250th St
- 826 2nd St
- 12972 120th St
- 2260 120th St
- 1365 Van Ave
- 2250 Nettle Ave
- 602 Claydigger Run
- 421 Brickyard Rd
- 419 Brickyard Rd
- 417 Brickyard Rd
- 410 Brickyard Rd
- 409 Brickyard Rd
- 718 Gilman St
- 319 N 6th St
- 202 Brickyard Ct
- 200 Brickyard Ct
- 421 Sherman St
- 212 Park St
Your Personal Tour Guide
Ask me questions while you tour the home.