704 S 3rd St Cordele, GA 31015
Estimated Value: $95,285 - $134,000
3
Beds
2
Baths
1,126
Sq Ft
$101/Sq Ft
Est. Value
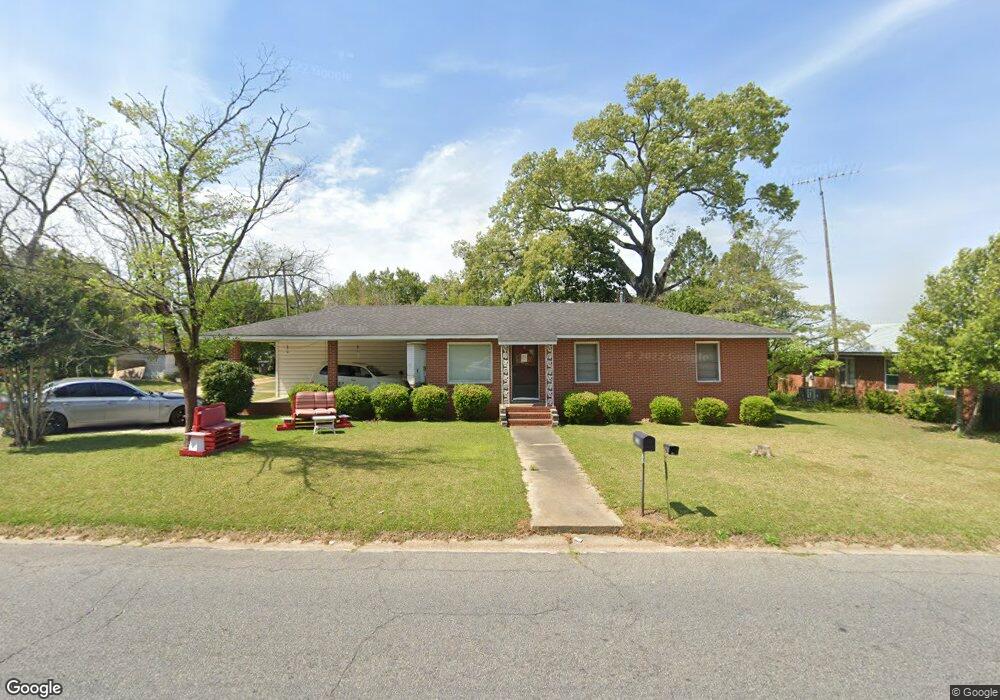
About This Home
This home is located at 704 S 3rd St, Cordele, GA 31015 and is currently estimated at $114,071, approximately $101 per square foot. 704 S 3rd St is a home located in Crisp County with nearby schools including Crisp County Elementary School, Crisp County Primary School, and Crisp County Middle School.
Ownership History
Date
Name
Owned For
Owner Type
Purchase Details
Closed on
Aug 1, 2018
Sold by
Brown Eugene A
Bought by
Howell Sara J
Current Estimated Value
Purchase Details
Closed on
May 26, 2015
Sold by
A Home For Every Heart Llc
Bought by
Brown Eugene A and Howell Sara J
Purchase Details
Closed on
May 13, 2011
Sold by
Lewis Robin T
Bought by
A Home For Every Heart Llc
Purchase Details
Closed on
Jan 1, 2011
Sold by
Lewis Robin T
Bought by
Lewis Robin T
Purchase Details
Closed on
Jun 14, 2002
Sold by
Southwell Donna S
Bought by
Lewis Robin T
Purchase Details
Closed on
Oct 6, 2000
Sold by
Puckett Edna H
Bought by
Southwell Donna S
Purchase Details
Closed on
Jan 6, 1995
Sold by
Puckett Edna
Bought by
Southwell Donna S
Purchase Details
Closed on
Dec 19, 1994
Sold by
Puckett Hugh and Puckett Edna
Bought by
Puckett Hugh W and Puckett Ed
Purchase Details
Closed on
Feb 25, 1967
Sold by
Haire Myrtle Etal
Bought by
Puckett Hugh and Puckett Edna
Create a Home Valuation Report for This Property
The Home Valuation Report is an in-depth analysis detailing your home's value as well as a comparison with similar homes in the area
Home Values in the Area
Average Home Value in this Area
Purchase History
| Date | Buyer | Sale Price | Title Company |
|---|---|---|---|
| Howell Sara J | -- | -- | |
| Brown Eugene A | $77,000 | -- | |
| A Home For Every Heart Llc | $55,000 | -- | |
| Lewis Robin T | $69,000 | -- | |
| Lewis Robin T | $45,000 | -- | |
| Southwell Donna S | -- | -- | |
| Southwell Donna S | -- | -- | |
| Puckett Edna | -- | -- | |
| Puckett Hugh W | -- | -- | |
| Puckett Hugh | -- | -- |
Source: Public Records
Tax History Compared to Growth
Tax History
| Year | Tax Paid | Tax Assessment Tax Assessment Total Assessment is a certain percentage of the fair market value that is determined by local assessors to be the total taxable value of land and additions on the property. | Land | Improvement |
|---|---|---|---|---|
| 2024 | $1,228 | $34,277 | $1,250 | $33,027 |
| 2023 | $1,130 | $30,145 | $1,250 | $28,895 |
| 2022 | $754 | $28,510 | $1,250 | $27,260 |
| 2021 | $738 | $26,874 | $1,250 | $25,624 |
| 2020 | $756 | $26,874 | $1,250 | $25,624 |
| 2019 | $762 | $26,874 | $1,250 | $25,624 |
| 2018 | $619 | $20,984 | $2,000 | $18,984 |
| 2017 | $852 | $20,984 | $2,000 | $18,984 |
| 2016 | $621 | $20,984 | $2,000 | $18,984 |
| 2015 | -- | $20,984 | $2,000 | $18,984 |
| 2014 | -- | $20,984 | $2,000 | $18,984 |
| 2013 | -- | $20,984 | $2,000 | $18,984 |
Source: Public Records
Map
Nearby Homes