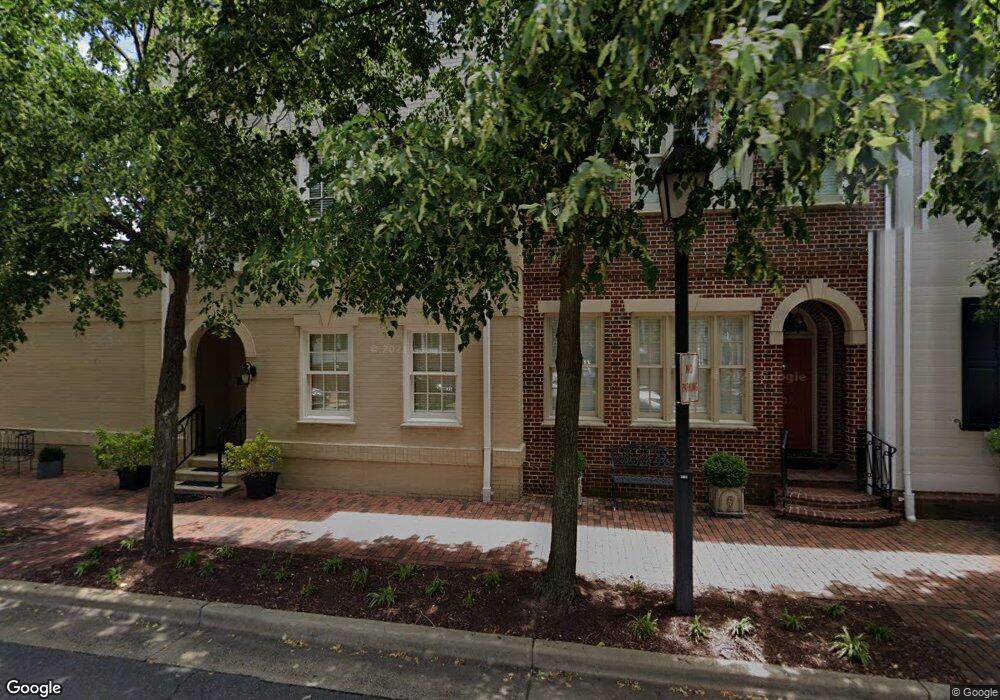
704 S Union St Alexandria, VA 22314
Old Town NeighborhoodEstimated Value: $1,566,306 - $2,284,000
--
Bed
5
Baths
2,499
Sq Ft
$738/Sq Ft
Est. Value
About This Home
This home is located at 704 S Union St, Alexandria, VA 22314 and is currently estimated at $1,843,769, approximately $737 per square foot. 704 S Union St is a home located in Alexandria City with nearby schools including Lyles-Crouch Elementary, George Washington Middle School, and Alexandria City High School.
Ownership History
Date
Name
Owned For
Owner Type
Purchase Details
Closed on
Aug 27, 2003
Sold by
Dwight Nancy
Bought by
Behler Lynn
Current Estimated Value
Home Financials for this Owner
Home Financials are based on the most recent Mortgage that was taken out on this home.
Original Mortgage
$690,000
Outstanding Balance
$307,935
Interest Rate
5.69%
Mortgage Type
New Conventional
Estimated Equity
$1,535,834
Purchase Details
Closed on
Aug 23, 2002
Sold by
Turim Jay
Bought by
Dwight Nancy
Purchase Details
Closed on
Jan 29, 1999
Sold by
Mckinzie Richard V
Bought by
Turim Jay
Home Financials for this Owner
Home Financials are based on the most recent Mortgage that was taken out on this home.
Original Mortgage
$240,000
Interest Rate
6.74%
Purchase Details
Closed on
Jul 5, 1994
Sold by
Hertan Ds
Bought by
Mckinzie Richard V
Home Financials for this Owner
Home Financials are based on the most recent Mortgage that was taken out on this home.
Original Mortgage
$440,000
Interest Rate
8.55%
Create a Home Valuation Report for This Property
The Home Valuation Report is an in-depth analysis detailing your home's value as well as a comparison with similar homes in the area
Home Values in the Area
Average Home Value in this Area
Purchase History
| Date | Buyer | Sale Price | Title Company |
|---|---|---|---|
| Behler Lynn | $920,000 | -- | |
| Dwight Nancy | $830,000 | -- | |
| Turim Jay | $70,000 | -- | |
| Mckinzie Richard V | $550,000 | -- |
Source: Public Records
Mortgage History
| Date | Status | Borrower | Loan Amount |
|---|---|---|---|
| Open | Mckinzie Richard V | $690,000 | |
| Previous Owner | Turim Jay | $240,000 | |
| Previous Owner | Mckinzie Richard V | $440,000 |
Source: Public Records
Tax History Compared to Growth
Tax History
| Year | Tax Paid | Tax Assessment Tax Assessment Total Assessment is a certain percentage of the fair market value that is determined by local assessors to be the total taxable value of land and additions on the property. | Land | Improvement |
|---|---|---|---|---|
| 2025 | $16,245 | $1,386,910 | $798,796 | $588,114 |
| 2024 | $16,245 | $1,419,583 | $798,796 | $620,787 |
| 2023 | $14,589 | $1,314,292 | $726,178 | $588,114 |
| 2022 | $13,915 | $1,253,574 | $691,598 | $561,976 |
| 2021 | $12,491 | $1,125,355 | $628,725 | $496,630 |
| 2020 | $12,325 | $1,100,009 | $610,412 | $489,597 |
| 2019 | $12,102 | $1,070,943 | $581,346 | $489,597 |
| 2018 | $11,849 | $1,048,583 | $558,986 | $489,597 |
| 2017 | $11,918 | $1,054,687 | $555,938 | $498,749 |
| 2016 | $11,317 | $1,054,687 | $555,938 | $498,749 |
| 2015 | $10,724 | $1,028,213 | $529,464 | $498,749 |
| 2014 | $13,047 | $1,250,940 | $529,464 | $721,476 |
Source: Public Records
Map
Nearby Homes
- 602 Fords Landing Way
- 210 Gibbon St
- 911 S Lee St
- 222 Green St
- 707 S Royal St
- 430 S Lee St
- 801 S Pitt St Unit 326
- 209 Wolfe St
- 621 S Saint Asaph St
- 19 Pioneer Mill Way
- 15 Pioneer Mill Way
- 408 Wolfe St
- 607 S Saint Asaph St
- 123 Duke St
- 223 S Union St
- 510 Wolfe St
- 411 S Saint Asaph St
- 208 S Lee St
- 714 Gibbon St
- 719 Gibbon St
- 702 S Union St
- 706 S Union St
- 700 S Union St
- 708 S Union St
- 710 S Union St
- 714 Battery Place
- 716 Battery Place
- 712 Battery Place
- 718 Battery Place
- 100 Franklin St
- 720 Battery Place
- 709 S Union St
- 711 S Union St
- 712 S Union St
- 102 Franklin St
- 722 Battery Place
- 715 S Union St
- 18 Franklin St
- 714 S Union St
- 724 Battery Place