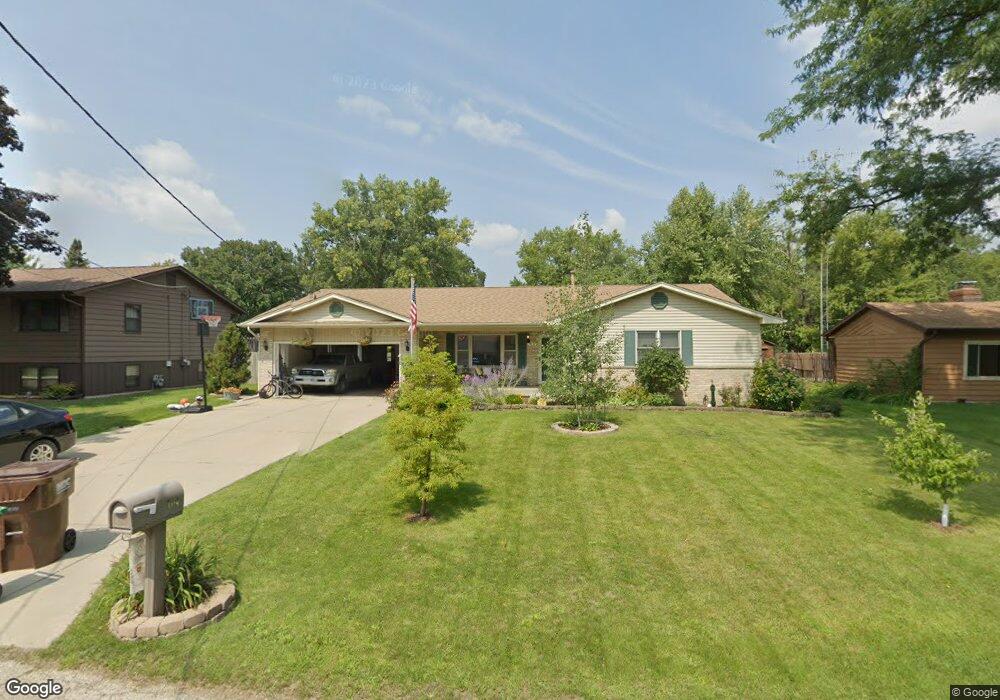
704 Stevenson St Marengo, IL 60152
Estimated Value: $198,000 - $281,664
3
Beds
--
Bath
--
Sq Ft
8,320
Sq Ft Lot
About This Home
This home is located at 704 Stevenson St, Marengo, IL 60152 and is currently estimated at $254,916. 704 Stevenson St is a home located in McHenry County with nearby schools including Locust Elementary School, Marengo Community Middle School, and Marengo Community High School.
Ownership History
Date
Name
Owned For
Owner Type
Purchase Details
Closed on
Feb 11, 2021
Sold by
Smith Matthew D and Smith Lisa M
Bought by
Smith Matthew D and Smith Lisa M
Current Estimated Value
Home Financials for this Owner
Home Financials are based on the most recent Mortgage that was taken out on this home.
Original Mortgage
$144,500
Outstanding Balance
$106,369
Interest Rate
2.7%
Mortgage Type
New Conventional
Estimated Equity
$148,547
Purchase Details
Closed on
Jul 27, 2006
Sold by
Jansen James P and Jansen Carol V
Bought by
Smith Matthew D and Winter Lisa M
Home Financials for this Owner
Home Financials are based on the most recent Mortgage that was taken out on this home.
Original Mortgage
$154,000
Interest Rate
6.88%
Mortgage Type
Purchase Money Mortgage
Purchase Details
Closed on
Jul 12, 2002
Sold by
Singer Dennis R and Singer Laurie J
Bought by
Jansen James P and Jansen Carol
Home Financials for this Owner
Home Financials are based on the most recent Mortgage that was taken out on this home.
Original Mortgage
$156,291
Interest Rate
6.79%
Mortgage Type
FHA
Create a Home Valuation Report for This Property
The Home Valuation Report is an in-depth analysis detailing your home's value as well as a comparison with similar homes in the area
Home Values in the Area
Average Home Value in this Area
Purchase History
| Date | Buyer | Sale Price | Title Company |
|---|---|---|---|
| Smith Matthew D | -- | M I S File No | |
| Smith Matthew D | $192,500 | St | |
| Jansen James P | $158,500 | -- |
Source: Public Records
Mortgage History
| Date | Status | Borrower | Loan Amount |
|---|---|---|---|
| Open | Smith Matthew D | $144,500 | |
| Closed | Smith Matthew D | $154,000 | |
| Previous Owner | Jansen James P | $156,291 |
Source: Public Records
Tax History Compared to Growth
Tax History
| Year | Tax Paid | Tax Assessment Tax Assessment Total Assessment is a certain percentage of the fair market value that is determined by local assessors to be the total taxable value of land and additions on the property. | Land | Improvement |
|---|---|---|---|---|
| 2024 | $5,818 | $84,671 | $15,783 | $68,888 |
| 2023 | $5,635 | $74,639 | $13,913 | $60,726 |
| 2022 | $5,517 | $67,498 | $12,582 | $54,916 |
| 2021 | $5,114 | $61,501 | $11,464 | $50,037 |
| 2020 | $5,017 | $58,528 | $10,910 | $47,618 |
| 2019 | $5,292 | $55,455 | $10,337 | $45,118 |
| 2018 | $4,896 | $51,943 | $9,682 | $42,261 |
| 2017 | $4,725 | $49,202 | $9,171 | $40,031 |
| 2016 | $4,552 | $45,971 | $8,569 | $37,402 |
| 2013 | -- | $44,979 | $8,385 | $36,594 |
Source: Public Records
Map
Nearby Homes
- 860 Woodland Ct
- 212 E Van Buren St
- 854 Walnut Ct
- 830 N Taylor St
- 115 Jackson St
- 819 Whitetail Dr
- 817 Whitetail Dr
- The Charlotte Plan at Deerpass Estates
- The Remington Plan at Deerpass Estates
- The Williamsburg Plan at Deerpass Estates
- 790 Cascade Dr
- 906 N State St
- 900 Partridge Cir
- 1101 N State St
- 422 Damen St
- 214 S Prospect St
- 704 Echo (Lot 21) Trail
- 806 Echo (Lot 22) Trail
- 7 ACRES Menge Rd
- 802 Echo (Lot 23) Trail
- 558 Grace St
- 702 Stevenson St
- 715 Stevenson St
- 700 Stevenson St
- 717 Stevenson St
- 620 Telegraph St
- 254 Telegraph St
- 515 Artell St
- 514 Grace St
- 610 Stevenson St
- 559 Grace St
- 617 Stevenson St
- 618 Telegraph St
- 427 Artell St
- 553 Grace St
- 452 Grace St
- 510 Artell St
- 610 Telegraph St
- 602 Stevenson St
- 619 1st Ave