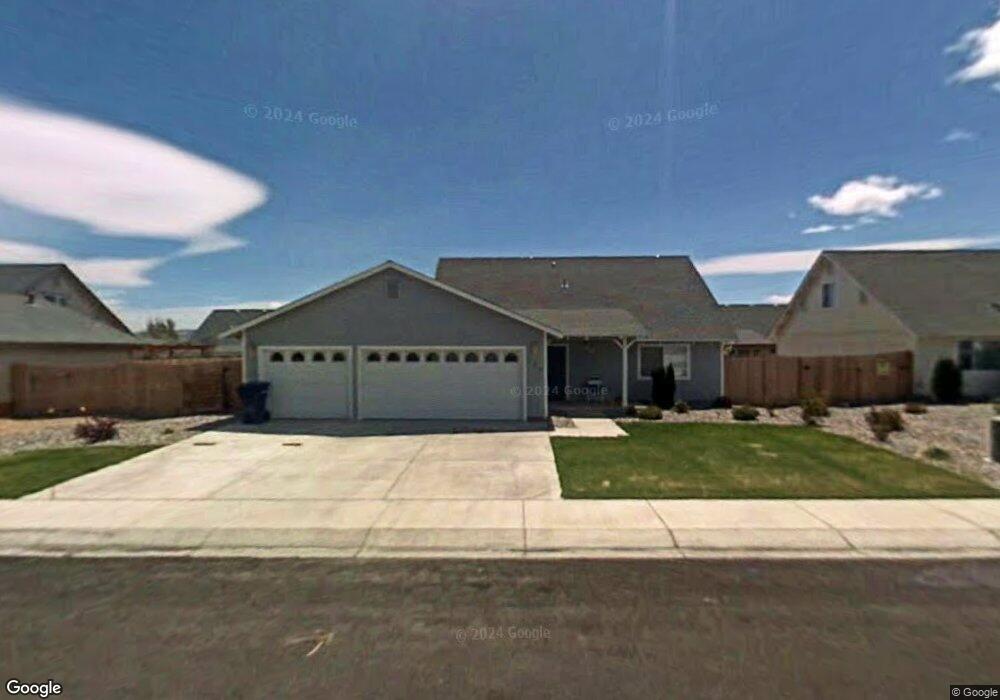
704 Tanglewood Dr Fernley, NV 89408
Estimated Value: $365,000 - $379,000
3
Beds
3
Baths
1,618
Sq Ft
$230/Sq Ft
Est. Value
About This Home
This home is located at 704 Tanglewood Dr, Fernley, NV 89408 and is currently estimated at $372,581, approximately $230 per square foot. 704 Tanglewood Dr is a home located in Lyon County with nearby schools including Cottonwood Elementary School, Fernley Intermediate School, and Fernley High School.
Ownership History
Date
Name
Owned For
Owner Type
Purchase Details
Closed on
Jul 2, 2019
Sold by
Mccloud Robert and Mccloud Katelyn
Bought by
Mccloud Jason R and Mccloud Shaney L
Current Estimated Value
Purchase Details
Closed on
Aug 2, 2010
Sold by
Pnc Mortgage
Bought by
Mccloud Robert and Mccloud Katelyn
Purchase Details
Closed on
Apr 9, 2010
Sold by
Howard Catherine P
Bought by
Pnc Mortgage
Purchase Details
Closed on
Jun 16, 2005
Sold by
Schade Construction Inc
Bought by
Howard Catherine P
Home Financials for this Owner
Home Financials are based on the most recent Mortgage that was taken out on this home.
Original Mortgage
$156,400
Interest Rate
6.37%
Mortgage Type
Adjustable Rate Mortgage/ARM
Purchase Details
Closed on
Jan 28, 2005
Sold by
Smith Harold J and Smith Irwina W
Bought by
Schade Construction Inc
Home Financials for this Owner
Home Financials are based on the most recent Mortgage that was taken out on this home.
Original Mortgage
$97,000
Interest Rate
5.79%
Mortgage Type
Purchase Money Mortgage
Create a Home Valuation Report for This Property
The Home Valuation Report is an in-depth analysis detailing your home's value as well as a comparison with similar homes in the area
Home Values in the Area
Average Home Value in this Area
Purchase History
| Date | Buyer | Sale Price | Title Company |
|---|---|---|---|
| Mccloud Jason R | -- | None Available | |
| Mccloud Robert | $100,000 | Western Title Company | |
| Pnc Mortgage | $99,000 | Accommodation | |
| Howard Catherine P | $196,828 | Title Service & Escrow Co | |
| Schade Construction Inc | $200,000 | Accommodation |
Source: Public Records
Mortgage History
| Date | Status | Borrower | Loan Amount |
|---|---|---|---|
| Previous Owner | Howard Catherine P | $156,400 | |
| Previous Owner | Schade Construction Inc | $97,000 |
Source: Public Records
Tax History Compared to Growth
Tax History
| Year | Tax Paid | Tax Assessment Tax Assessment Total Assessment is a certain percentage of the fair market value that is determined by local assessors to be the total taxable value of land and additions on the property. | Land | Improvement |
|---|---|---|---|---|
| 2025 | $1,388 | $101,825 | $42,000 | $63,365 |
| 2024 | $1,757 | $102,244 | $42,000 | $63,683 |
| 2023 | $1,757 | $98,295 | $0 | $0 |
| 2022 | $1,657 | $96,825 | $42,000 | $54,825 |
| 2021 | $1,654 | $86,715 | $33,250 | $53,465 |
| 2020 | $1,611 | $84,634 | $33,250 | $51,384 |
| 2019 | $1,694 | $81,132 | $31,500 | $49,632 |
| 2018 | $1,660 | $69,389 | $21,000 | $48,389 |
| 2017 | $1,656 | $65,876 | $17,500 | $48,376 |
| 2016 | $1,469 | $45,420 | $5,780 | $39,640 |
| 2015 | $1,504 | $30,778 | $5,780 | $24,998 |
| 2014 | $1,472 | $30,189 | $5,780 | $24,409 |
Source: Public Records
Map
Nearby Homes
- 704 Tanglewood Dr Unit 1
- 706 Tanglewood Dr
- 816 Fairwood St
- 808 Fairwood St
- 820 Fairwood St
- 705 Tanglewood Dr
- 708 Tanglewood Dr
- 707 Tanglewood Dr
- 703 Tanglewood Dr
- 700 Tanglewood Dr
- 228 Wildwood St
- 824 Fairwood St
- 709 Tanglewood Dr
- 813 Fairwood St
- 817 Fairwood St
- 805 Fairwood St
- 000 Fernwood Dr
- 821 Fairwood St Unit 2
- 801 Fairwood St
- 230 Fernwood Dr