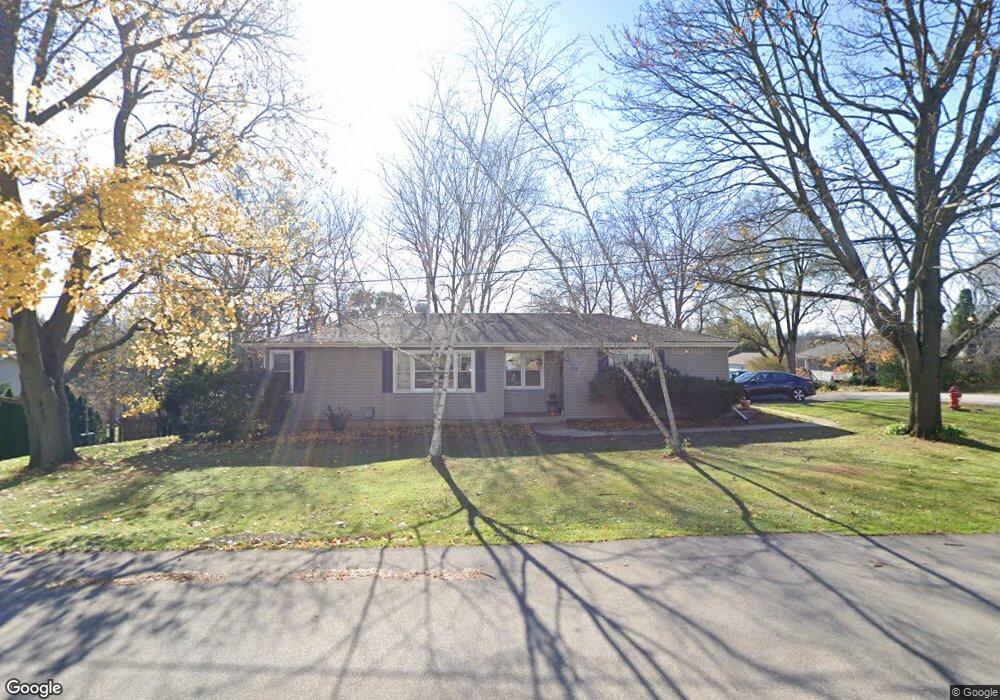
704 Willow St Lake In the Hills, IL 60156
Estimated Value: $233,228 - $307,000
--
Bed
--
Bath
1,128
Sq Ft
$237/Sq Ft
Est. Value
About This Home
This home is located at 704 Willow St, Lake In the Hills, IL 60156 and is currently estimated at $267,557, approximately $237 per square foot. 704 Willow St is a home located in McHenry County with nearby schools including Westfield Community School, Lake in the Hills Elementary School, and United Junior High School.
Ownership History
Date
Name
Owned For
Owner Type
Purchase Details
Closed on
Nov 17, 2006
Sold by
Kobige Sean
Bought by
Kobige Sean and Kobige Erica
Current Estimated Value
Home Financials for this Owner
Home Financials are based on the most recent Mortgage that was taken out on this home.
Original Mortgage
$20,888
Interest Rate
6.4%
Mortgage Type
New Conventional
Purchase Details
Closed on
Apr 30, 2003
Sold by
Kobige Kevin G
Bought by
Kobige Sean
Home Financials for this Owner
Home Financials are based on the most recent Mortgage that was taken out on this home.
Original Mortgage
$148,000
Outstanding Balance
$64,652
Interest Rate
5.86%
Mortgage Type
Unknown
Estimated Equity
$202,906
Purchase Details
Closed on
Jul 24, 1998
Sold by
Cabrera Charles A
Bought by
Kobige Kevin G
Home Financials for this Owner
Home Financials are based on the most recent Mortgage that was taken out on this home.
Original Mortgage
$108,691
Interest Rate
7.03%
Mortgage Type
FHA
Create a Home Valuation Report for This Property
The Home Valuation Report is an in-depth analysis detailing your home's value as well as a comparison with similar homes in the area
Home Values in the Area
Average Home Value in this Area
Purchase History
| Date | Buyer | Sale Price | Title Company |
|---|---|---|---|
| Kobige Sean | -- | Acquest Title Services Llc | |
| Kobige Sean | $148,000 | Multiple | |
| Kobige Kevin G | $109,500 | Land Title Company |
Source: Public Records
Mortgage History
| Date | Status | Borrower | Loan Amount |
|---|---|---|---|
| Closed | Kobige Sean | $20,888 | |
| Open | Kobige Sean | $148,000 | |
| Closed | Kobige Kevin G | $108,691 |
Source: Public Records
Tax History Compared to Growth
Tax History
| Year | Tax Paid | Tax Assessment Tax Assessment Total Assessment is a certain percentage of the fair market value that is determined by local assessors to be the total taxable value of land and additions on the property. | Land | Improvement |
|---|---|---|---|---|
| 2024 | -- | $66,961 | $10,034 | $56,927 |
| 2023 | $4,097 | $59,888 | $8,974 | $50,914 |
| 2022 | $4,097 | $56,206 | $8,099 | $48,107 |
| 2021 | $4,097 | $52,362 | $7,545 | $44,817 |
| 2020 | $4,097 | $50,508 | $7,278 | $43,230 |
| 2019 | $3,991 | $48,342 | $6,966 | $41,376 |
| 2018 | $2,537 | $31,827 | $9,408 | $22,419 |
| 2017 | $2,463 | $29,983 | $8,863 | $21,120 |
| 2016 | $2,399 | $28,122 | $8,313 | $19,809 |
| 2013 | -- | $36,004 | $7,755 | $28,249 |
Source: Public Records
Map
Nearby Homes
- 992 Mcphee Dr
- 338 Hiawatha Dr
- 1049 Horizon Ridge
- 900 Windstone Ct
- 70 Hilltop Dr Unit 4
- 1019 Maple St
- 807 Menominee Dr
- 809 Menominee Dr
- 7 Michael Ct
- LOT 3 Blackhawk Dr
- Lots 10 & 11 Ramble Rd
- 909 Roger St
- 1114 Ash St
- 16 Brian Ct
- 1345 Cunat Ct Unit 1B
- 1345 Cunat Ct Unit 2D
- 1431 Essex St
- 266 Grandview Ct
- 135 Arquilla Dr
- 113 Pheasant Trail
- 606 Mohican Trail
- 611 Seminole Trail Unit 10
- 604 Mohican Trail
- 609 Seminole Trail
- 702 Mohican Trail
- 607 Seminole Trail
- 604 Willow St
- 602 Mohican Trail
- 607 Mohican Trail
- 713 Willow St
- 605 Mohican Trail
- 603 Seminole Trail
- 723 Willow St
- 701 Mohican Trail
- 704 Mohican Trail
- 600 Mohican Trail
- 603 Mohican Trail
- 601 Seminole Trail
- 733 Willow St
- 744 Willow St