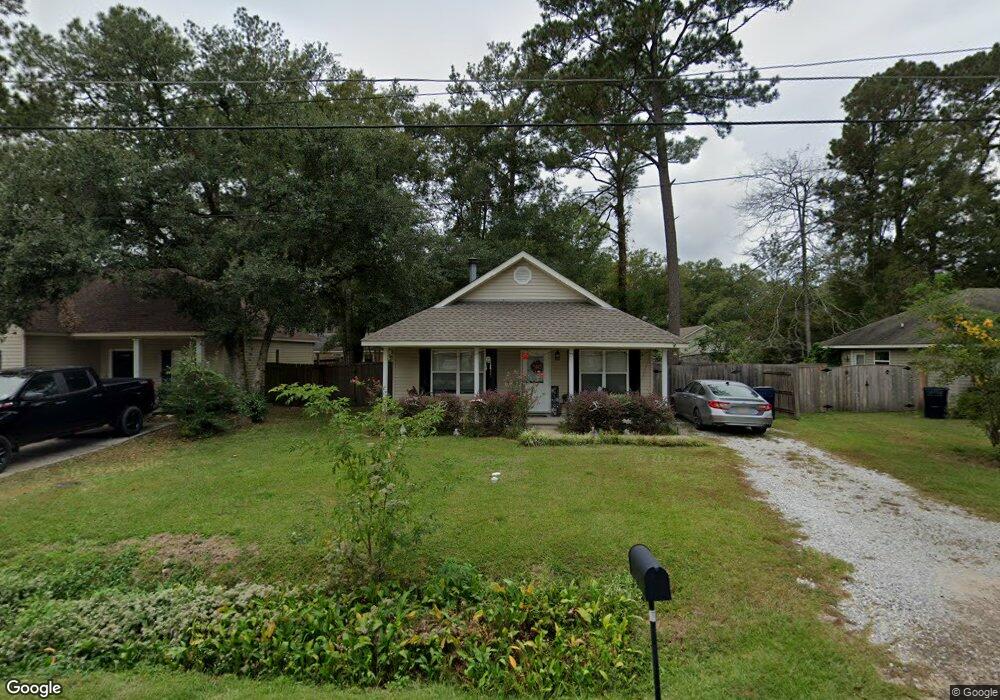
70407 1st St Covington, LA 70433
Estimated Value: $204,000 - $221,000
3
Beds
2
Baths
1,242
Sq Ft
$171/Sq Ft
Est. Value
About This Home
This home is located at 70407 1st St, Covington, LA 70433 and is currently estimated at $212,571, approximately $171 per square foot. 70407 1st St is a home located in St. Tammany Parish with nearby schools including E. E. Lyon Elementary School, Pine View Middle School, and Fontainebleau Junior High School.
Ownership History
Date
Name
Owned For
Owner Type
Purchase Details
Closed on
Aug 13, 2020
Sold by
Glass Jaime Marie and Glass Jason Flyod
Bought by
Savoie Holly A
Current Estimated Value
Home Financials for this Owner
Home Financials are based on the most recent Mortgage that was taken out on this home.
Original Mortgage
$162,011
Outstanding Balance
$142,132
Interest Rate
2.9%
Mortgage Type
FHA
Estimated Equity
$70,439
Purchase Details
Closed on
Sep 23, 2016
Sold by
Guidry Jamie Theobald
Bought by
Glass Jason Floyd and Glass Jaime Marie
Home Financials for this Owner
Home Financials are based on the most recent Mortgage that was taken out on this home.
Original Mortgage
$151,053
Interest Rate
3.43%
Mortgage Type
New Conventional
Purchase Details
Closed on
Mar 3, 2016
Sold by
Us Department Of Agriculture
Bought by
Guidry Jamie T
Purchase Details
Closed on
Dec 9, 2015
Sold by
St Tammany Parish Sheriff
Bought by
Us Dep Of Agriculture
Create a Home Valuation Report for This Property
The Home Valuation Report is an in-depth analysis detailing your home's value as well as a comparison with similar homes in the area
Home Values in the Area
Average Home Value in this Area
Purchase History
| Date | Buyer | Sale Price | Title Company |
|---|---|---|---|
| Savoie Holly A | $165,000 | Team Title | |
| Glass Jason Floyd | $146,900 | Fidelity National Title | |
| Guidry Jamie T | $84,500 | -- | |
| Us Dep Of Agriculture | $83,334 | -- |
Source: Public Records
Mortgage History
| Date | Status | Borrower | Loan Amount |
|---|---|---|---|
| Open | Savoie Holly A | $162,011 | |
| Previous Owner | Glass Jason Floyd | $151,053 |
Source: Public Records
Tax History
| Year | Tax Paid | Tax Assessment Tax Assessment Total Assessment is a certain percentage of the fair market value that is determined by local assessors to be the total taxable value of land and additions on the property. | Land | Improvement |
|---|---|---|---|---|
| 2025 | $802 | $14,105 | $2,500 | $11,605 |
| 2024 | $802 | $14,105 | $2,500 | $11,605 |
| 2023 | $832 | $11,863 | $2,500 | $9,363 |
| 2022 | $58,476 | $11,863 | $2,500 | $9,363 |
| 2021 | $584 | $11,863 | $2,500 | $9,363 |
| 2020 | $583 | $11,863 | $2,500 | $9,363 |
| 2019 | $1,573 | $11,878 | $2,500 | $9,378 |
| 2018 | $1,579 | $11,878 | $2,500 | $9,378 |
| 2017 | $1,673 | $11,878 | $2,500 | $9,378 |
| 2016 | $1,768 | $13,078 | $2,090 | $10,988 |
| 2015 | $724 | $12,515 | $2,000 | $10,515 |
| 2014 | $717 | $12,515 | $2,000 | $10,515 |
| 2013 | -- | $12,515 | $2,000 | $10,515 |
Source: Public Records
Map
Nearby Homes
Your Personal Tour Guide
Ask me questions while you tour the home.