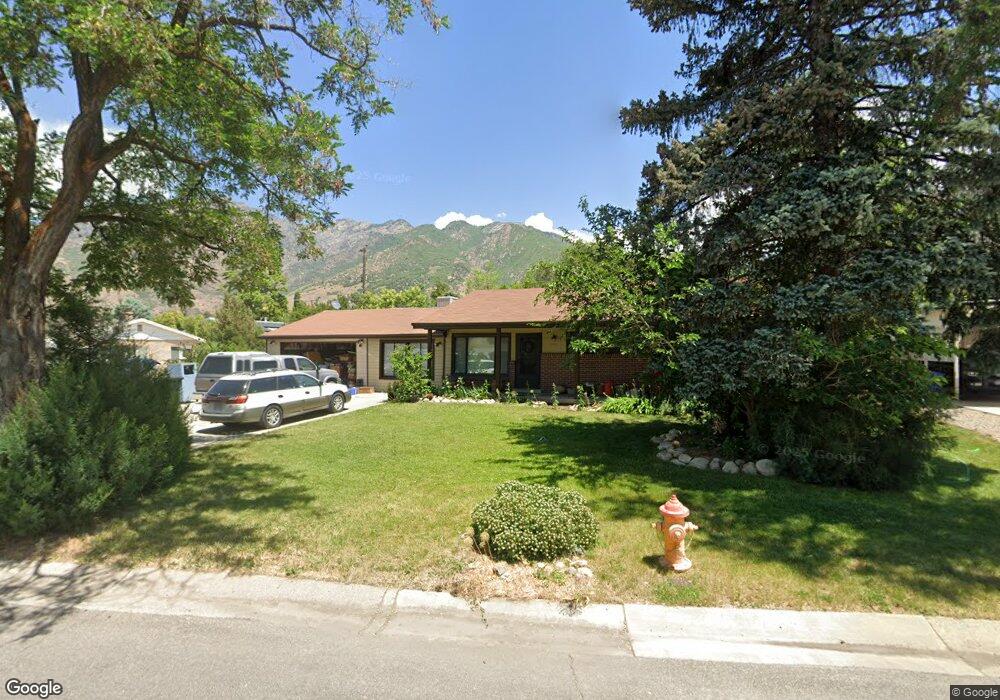
7041 S 3050 E Salt Lake City, UT 84121
Estimated Value: $595,000 - $673,000
3
Beds
2
Baths
1,530
Sq Ft
$410/Sq Ft
Est. Value
About This Home
This home is located at 7041 S 3050 E, Salt Lake City, UT 84121 and is currently estimated at $627,211, approximately $409 per square foot. 7041 S 3050 E is a home located in Salt Lake County with nearby schools including Butler School, Butler Middle School, and Brighton High School.
Ownership History
Date
Name
Owned For
Owner Type
Purchase Details
Closed on
Sep 29, 2017
Sold by
Baker Timothy S
Bought by
Baker Deborah Bibo
Current Estimated Value
Purchase Details
Closed on
Oct 4, 2001
Sold by
Speer Richard and Speer Maria P
Bought by
Baker Timothy S
Home Financials for this Owner
Home Financials are based on the most recent Mortgage that was taken out on this home.
Original Mortgage
$102,400
Outstanding Balance
$40,112
Interest Rate
6.9%
Estimated Equity
$587,099
Purchase Details
Closed on
Sep 21, 2000
Sold by
Speer Maria P
Bought by
Speer Richard
Home Financials for this Owner
Home Financials are based on the most recent Mortgage that was taken out on this home.
Original Mortgage
$92,250
Interest Rate
12.45%
Purchase Details
Closed on
Sep 20, 2000
Sold by
Speer Richard
Bought by
Speer Richard and Speer Maria P
Home Financials for this Owner
Home Financials are based on the most recent Mortgage that was taken out on this home.
Original Mortgage
$92,250
Interest Rate
12.45%
Create a Home Valuation Report for This Property
The Home Valuation Report is an in-depth analysis detailing your home's value as well as a comparison with similar homes in the area
Home Values in the Area
Average Home Value in this Area
Purchase History
| Date | Buyer | Sale Price | Title Company |
|---|---|---|---|
| Baker Deborah Bibo | -- | None Available | |
| Baker Timothy S | -- | Equity Title | |
| Speer Richard | -- | -- | |
| Speer Richard | -- | -- |
Source: Public Records
Mortgage History
| Date | Status | Borrower | Loan Amount |
|---|---|---|---|
| Open | Baker Timothy S | $102,400 | |
| Previous Owner | Speer Richard | $92,250 | |
| Closed | Baker Timothy S | $25,600 |
Source: Public Records
Tax History Compared to Growth
Tax History
| Year | Tax Paid | Tax Assessment Tax Assessment Total Assessment is a certain percentage of the fair market value that is determined by local assessors to be the total taxable value of land and additions on the property. | Land | Improvement |
|---|---|---|---|---|
| 2025 | $2,480 | $514,900 | $151,600 | $363,300 |
| 2024 | $2,480 | $442,300 | $136,500 | $305,800 |
| 2023 | $2,479 | $429,900 | $129,700 | $300,200 |
| 2022 | $2,582 | $441,800 | $127,200 | $314,600 |
| 2021 | $2,299 | $327,400 | $101,100 | $226,300 |
| 2020 | $2,209 | $295,600 | $101,100 | $194,500 |
| 2019 | $2,125 | $276,200 | $95,400 | $180,800 |
| 2018 | $1,960 | $264,800 | $95,400 | $169,400 |
| 2017 | $1,987 | $247,600 | $95,400 | $152,200 |
| 2016 | $1,997 | $253,800 | $95,400 | $158,400 |
| 2015 | $2,314 | $232,300 | $92,500 | $139,800 |
| 2014 | $2,235 | $233,500 | $94,400 | $139,100 |
Source: Public Records
Map
Nearby Homes
- 7129 S 3080 E
- 2995 E 7110 S
- 3184 Barnhill Bay
- 2968 Pine View Dr S
- 6877 Pineview Cir
- 2944 E 7230 S
- 3071 E 7335 S
- 2712 E 7115 S
- 6721 S Costa Cove
- 6680 Coba Ct
- 3404 Enchanted Hills Dr
- 7506 Claret St
- 2532 E 6830 S
- 7491 S 2700 E
- 6910 S Promenade Dr
- 7622 S Cambria Cir
- 3603 E Macintosh Ln
- 6888 S Hillside Village Cir
- 2559 Cupecoy Dr
- 6557 S 2600 E
- 7051 S 3050 E
- 7029 White Aspen Cove
- 3070 Fort Union Blvd
- 3060 Fort Union Blvd
- 3060 E Fort Union Blvd
- 7029 S White Aspen Cove
- 7021 S White Aspen Cove
- 7037 S White Aspen Cove
- 7021 White Aspen Cove
- 7015 S White Aspen Cove
- 7037 White Aspen Cove
- 7061 S 3050 E
- 7040 S 3050 E
- 3040 Fort Union Blvd
- 7015 White Aspen Cove
- 7050 S 3050 E
- 3083 E 7070 S
- 3040 E 7000 S
- 7038 S Horizon Cir
- 3093 E 7070 S