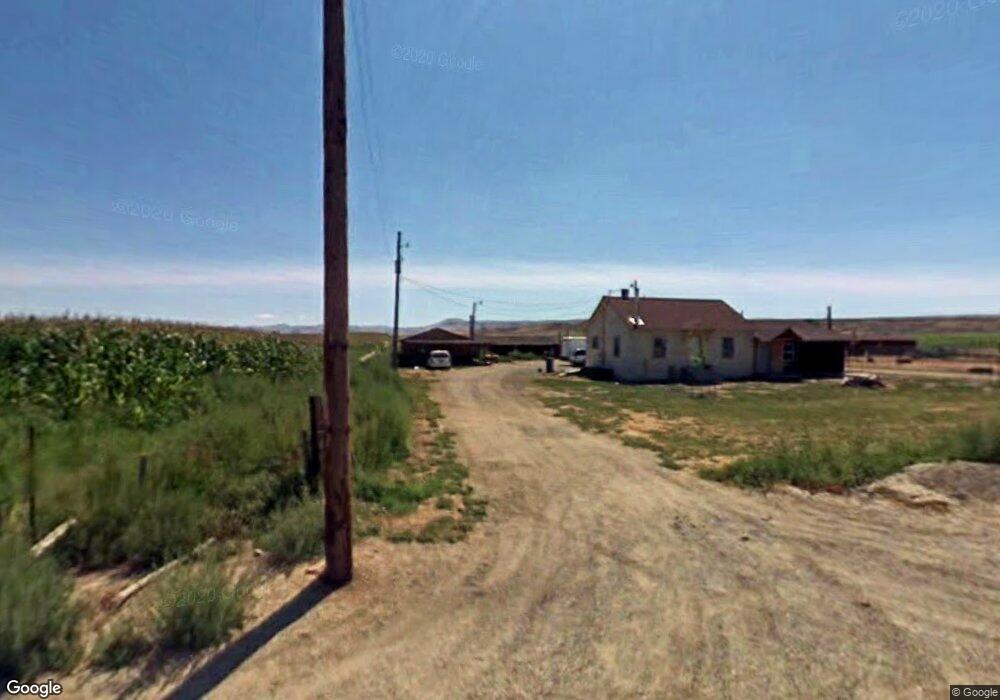
7044 Poison Creek Rd Marsing, ID 83639
Estimated Value: $673,000 - $727,330
4
Beds
1
Bath
2,000
Sq Ft
$353/Sq Ft
Est. Value
About This Home
This home is located at 7044 Poison Creek Rd, Marsing, ID 83639 and is currently estimated at $705,833, approximately $352 per square foot. 7044 Poison Creek Rd is a home located in Owyhee County with nearby schools including Marsing Elementary School, Marsing Middle School, and Marsing High School.
Ownership History
Date
Name
Owned For
Owner Type
Purchase Details
Closed on
Jul 9, 2024
Sold by
Hall John A and Hall Holly S
Bought by
Hall John A and Hall Holly S
Current Estimated Value
Home Financials for this Owner
Home Financials are based on the most recent Mortgage that was taken out on this home.
Original Mortgage
$167,100
Outstanding Balance
$165,119
Interest Rate
7.03%
Mortgage Type
Credit Line Revolving
Estimated Equity
$540,714
Purchase Details
Closed on
Jun 23, 2005
Sold by
Rancho Del Rio Inc
Bought by
Hall John A
Home Financials for this Owner
Home Financials are based on the most recent Mortgage that was taken out on this home.
Original Mortgage
$106,400
Interest Rate
5.72%
Mortgage Type
New Conventional
Create a Home Valuation Report for This Property
The Home Valuation Report is an in-depth analysis detailing your home's value as well as a comparison with similar homes in the area
Home Values in the Area
Average Home Value in this Area
Purchase History
| Date | Buyer | Sale Price | Title Company |
|---|---|---|---|
| Hall John A | -- | None Listed On Document | |
| Hall John A | -- | -- |
Source: Public Records
Mortgage History
| Date | Status | Borrower | Loan Amount |
|---|---|---|---|
| Open | Hall John A | $167,100 | |
| Previous Owner | Hall John A | $106,400 |
Source: Public Records
Tax History Compared to Growth
Tax History
| Year | Tax Paid | Tax Assessment Tax Assessment Total Assessment is a certain percentage of the fair market value that is determined by local assessors to be the total taxable value of land and additions on the property. | Land | Improvement |
|---|---|---|---|---|
| 2024 | -- | $519,251 | $96,371 | $422,880 |
| 2023 | $1,831 | $475,591 | $96,371 | $379,220 |
| 2022 | $2,228 | $475,591 | $96,371 | $379,220 |
| 2021 | $1,591 | $315,691 | $70,971 | $244,720 |
| 2020 | $1,551 | $280,620 | $37,786 | $242,834 |
| 2019 | $1,264 | $219,293 | $37,839 | $181,454 |
| 2018 | $1,609 | $222,179 | $32,132 | $190,047 |
| 2017 | $1,254 | $212,293 | $32,633 | $179,660 |
| 2016 | $812 | $140,701 | $30,961 | $109,740 |
| 2014 | $611 | $116,812 | $28,212 | $88,600 |
| 2011 | -- | $112,143 | $20,989 | $91,154 |
Source: Public Records
Map
Nearby Homes
- 8142 Us Highway 95
- 5815 Pasco Rd
- TBD Poison Creek Grade Rd
- 5996 Whispering Hills Dr
- TBD Lot 5 Leilani Estates Subdivision
- 5886 Whispering Hills Dr
- 101 Twilight Trail
- 311 Patton St
- 7253 Riverview Dr
- 4564 E Thompson Rd
- 112 S 2nd Ave W
- 405 Live Oak Ave
- 309 River View Dr
- 311 Riverview Dr
- 101 1st St S
- 8141 Idaho 78
- TBD Island View Dr - Lot 2
- TBD Island View Dr - Lot 1
- 20056 Sunny Slope Rd
- TBD N Bruneau Rd