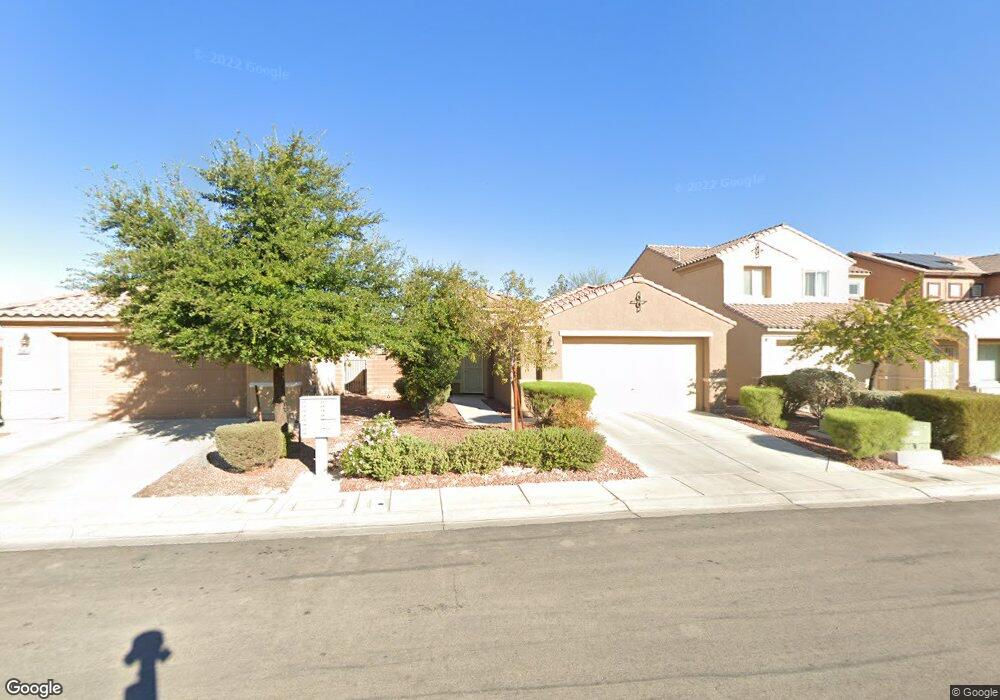
7045 Diver Ave Unit 2 North Las Vegas, NV 89084
Aliante NeighborhoodEstimated Value: $410,822 - $439,000
3
Beds
2
Baths
1,692
Sq Ft
$252/Sq Ft
Est. Value
About This Home
This home is located at 7045 Diver Ave Unit 2, North Las Vegas, NV 89084 and is currently estimated at $426,206, approximately $251 per square foot. 7045 Diver Ave Unit 2 is a home located in Clark County with nearby schools including Goynes Elementary School, Brian & Teri Cram Middle School, and Legacy High School.
Ownership History
Date
Name
Owned For
Owner Type
Purchase Details
Closed on
Dec 2, 2011
Sold by
Montesa Llc
Bought by
Toledo Leilani C
Current Estimated Value
Home Financials for this Owner
Home Financials are based on the most recent Mortgage that was taken out on this home.
Original Mortgage
$84,900
Outstanding Balance
$58,217
Interest Rate
4.06%
Mortgage Type
New Conventional
Estimated Equity
$367,989
Purchase Details
Closed on
Mar 15, 2011
Sold by
Korpi Julia A
Bought by
Montesa Llc
Purchase Details
Closed on
Jun 29, 2004
Sold by
Pn Ii Inc
Bought by
Korpi Julia A
Home Financials for this Owner
Home Financials are based on the most recent Mortgage that was taken out on this home.
Original Mortgage
$236,820
Interest Rate
5.25%
Mortgage Type
Purchase Money Mortgage
Create a Home Valuation Report for This Property
The Home Valuation Report is an in-depth analysis detailing your home's value as well as a comparison with similar homes in the area
Home Values in the Area
Average Home Value in this Area
Purchase History
| Date | Buyer | Sale Price | Title Company |
|---|---|---|---|
| Toledo Leilani C | $119,900 | National Title Company | |
| Montesa Llc | $92,000 | National Title Company | |
| Korpi Julia A | $296,026 | Lawyers Title Of Nevada |
Source: Public Records
Mortgage History
| Date | Status | Borrower | Loan Amount |
|---|---|---|---|
| Open | Toledo Leilani C | $84,900 | |
| Previous Owner | Korpi Julia A | $236,820 | |
| Closed | Korpi Julia A | $29,603 |
Source: Public Records
Tax History Compared to Growth
Tax History
| Year | Tax Paid | Tax Assessment Tax Assessment Total Assessment is a certain percentage of the fair market value that is determined by local assessors to be the total taxable value of land and additions on the property. | Land | Improvement |
|---|---|---|---|---|
| 2025 | $1,790 | $114,961 | $32,585 | $82,376 |
| 2024 | $1,738 | $114,961 | $32,585 | $82,376 |
| 2023 | $1,738 | $107,412 | $29,593 | $77,819 |
| 2022 | $1,688 | $94,728 | $23,940 | $70,788 |
| 2021 | $1,592 | $89,217 | $23,275 | $65,942 |
| 2020 | $1,542 | $88,316 | $22,943 | $65,373 |
| 2019 | $1,497 | $82,024 | $17,955 | $64,069 |
| 2018 | $1,454 | $76,613 | $14,805 | $61,808 |
| 2017 | $1,377 | $66,747 | $14,175 | $52,572 |
| 2016 | $1,377 | $59,001 | $10,500 | $48,501 |
| 2015 | $1,374 | $49,359 | $7,700 | $41,659 |
| 2014 | $1,334 | $38,576 | $7,700 | $30,876 |
Source: Public Records
Map
Nearby Homes
- 7025 Diver Ave
- 6933 Diver Ave
- 3237 Perching Bird Ln
- 7073 Seabirds Place
- 3209 Orange Orchid Place Unit 3
- 3213 Orange Orchid Place Unit 2
- 3208 Regal Swan Place Unit 3
- 3209 Regal Swan Place Unit 2
- 7009 Arcadia Creek St
- 3309 Jamaica Princess Place Unit 3
- 6703 Tufted Duck Way
- 6712 Tattler Dr
- 6720 Lavender Lilly Ln Unit 3
- 7140 Turkey Shoot Place
- 2208 Cactus Desert Ct
- 2208 Baywater Ave
- 3425 Fledgling Dr
- 6736 Sugarbird Ct
- 3624 Pelican Brief Ln
- 7264 Summer Duck Way
- 7049 Diver Ave
- 7041 Diver Ave
- 7041 Diver Ave Unit n/a
- 7053 Diver Ave
- 7033 Diver Ave Unit 2
- 7033 Diver Ave
- 7057 Diver Ave
- 7044 Diver Ave
- 7061 Diver Ave
- 7029 Diver Ave
- 7040 Diver Ave
- 7036 Diver Ave
- 7032 Diver Ave
- 7024 Dipper Ave
- 7065 Diver Ave
- 7028 Diver Ave
- 7020 Dipper Ave
- 7011 Dipper Ave
- 7021 Diver Ave
- 7024 Diver Ave