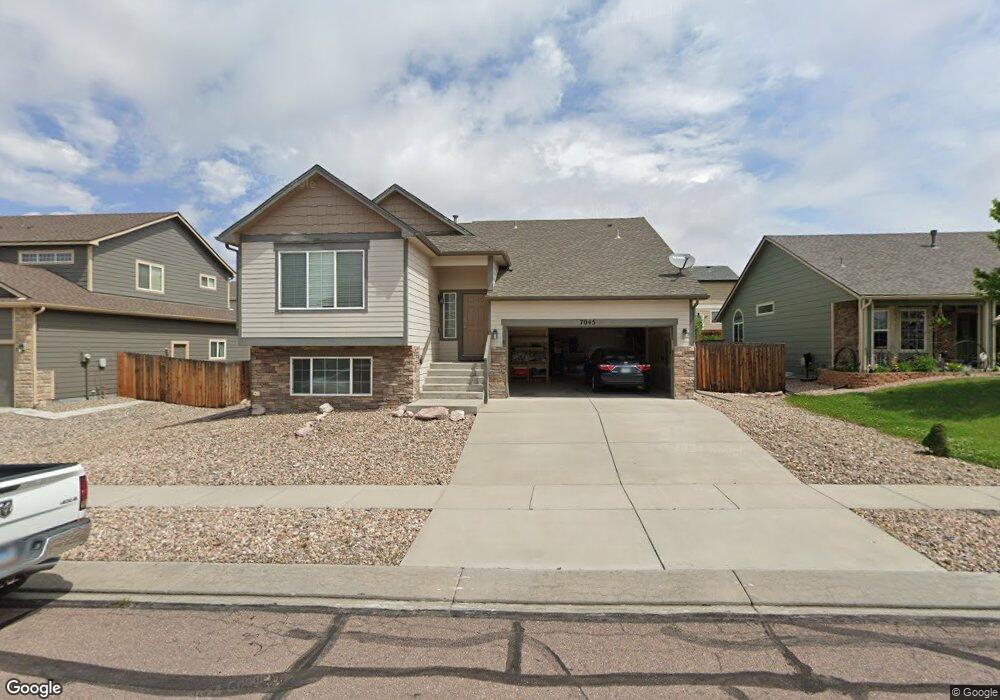
7045 Red Cardinal Loop Colorado Springs, CO 80908
Estimated Value: $464,736 - $523,000
3
Beds
3
Baths
2,257
Sq Ft
$220/Sq Ft
Est. Value
About This Home
This home is located at 7045 Red Cardinal Loop, Colorado Springs, CO 80908 and is currently estimated at $496,184, approximately $219 per square foot. 7045 Red Cardinal Loop is a home located in El Paso County with nearby schools including Inspiration View Elementary School, Skyview Middle School, and Vista Ridge High School.
Ownership History
Date
Name
Owned For
Owner Type
Purchase Details
Closed on
Jan 2, 2018
Sold by
Kayla Harris Kayla and Kayla Razuris
Bought by
Winchester Bruce M
Current Estimated Value
Purchase Details
Closed on
Jul 29, 2016
Sold by
Musgrave Curt M and Musgrave Carolyn
Bought by
Harris Kayla
Home Financials for this Owner
Home Financials are based on the most recent Mortgage that was taken out on this home.
Original Mortgage
$250,871
Interest Rate
3.37%
Mortgage Type
FHA
Purchase Details
Closed on
Mar 29, 2013
Sold by
Journey Homes Cs Llc
Bought by
Musgrave Curt M and Musgrave Carolyn
Home Financials for this Owner
Home Financials are based on the most recent Mortgage that was taken out on this home.
Original Mortgage
$227,070
Interest Rate
3.59%
Mortgage Type
VA
Purchase Details
Closed on
Oct 9, 2012
Sold by
Informa Inc
Bought by
Journey Homes Cs Llc
Create a Home Valuation Report for This Property
The Home Valuation Report is an in-depth analysis detailing your home's value as well as a comparison with similar homes in the area
Home Values in the Area
Average Home Value in this Area
Purchase History
| Date | Buyer | Sale Price | Title Company |
|---|---|---|---|
| Winchester Bruce M | $295,000 | Unified Title Co | |
| Harris Kayla | $255,500 | Unified Title Co Inc | |
| Musgrave Curt M | $219,817 | Heritage Title | |
| Journey Homes Cs Llc | $133,800 | Fidelity National Title Insu |
Source: Public Records
Mortgage History
| Date | Status | Borrower | Loan Amount |
|---|---|---|---|
| Previous Owner | Harris Kayla | $250,871 | |
| Previous Owner | Musgrave Curt M | $227,070 |
Source: Public Records
Tax History Compared to Growth
Tax History
| Year | Tax Paid | Tax Assessment Tax Assessment Total Assessment is a certain percentage of the fair market value that is determined by local assessors to be the total taxable value of land and additions on the property. | Land | Improvement |
|---|---|---|---|---|
| 2025 | $2,808 | $35,110 | -- | -- |
| 2024 | $3,159 | $33,830 | $6,030 | $27,800 |
| 2023 | $3,159 | $33,830 | $6,030 | $27,800 |
| 2022 | $2,709 | $24,240 | $5,590 | $18,650 |
| 2021 | $2,895 | $24,940 | $5,760 | $19,180 |
| 2020 | $2,750 | $21,980 | $5,010 | $16,970 |
| 2019 | $2,811 | $21,980 | $5,010 | $16,970 |
| 2018 | $2,243 | $17,770 | $4,320 | $13,450 |
| 2017 | $2,249 | $17,770 | $4,320 | $13,450 |
| 2016 | $2,049 | $16,730 | $4,140 | $12,590 |
| 2015 | $2,085 | $16,730 | $4,140 | $12,590 |
| 2014 | $2,066 | $16,400 | $4,140 | $12,260 |
Source: Public Records
Map
Nearby Homes
- 7716 Kiana Dr
- 7758 Camille Ct
- 7930 Lightwood Way
- 7740 Adventure Way
- 7718 Wagonwood Place
- 7557 Black Spruce Heights
- 7587 Black Spruce Heights
- 6829 Red Cardinal Loop
- 7898 Chasewood Loop
- 6806 Red Cardinal Loop
- 9194 Old Divide Dr
- 7577 Chasewood Loop
- 8127 Mockorange Heights
- 8308 Needle Drop Ct
- 7983 Martinwood Place
- 7991 Martinwood Place
- 6949 Dusty Miller Way
- 7913 Dry Willow Way
- 8294 Hardwood Cir
- 7923 Wagonwood Place
- 7057 Red Cardinal Loop
- 7039 Red Cardinal Loop
- 7235 Pearly Heath Rd
- 7225 Pearly Heath Rd
- 7245 Pearly Heath Rd
- 7215 Pearly Heath Rd
- 7033 Red Cardinal Loop
- 7255 Pearly Heath Rd
- 7063 Red Cardinal Loop
- 7046 Red Cardinal Loop
- 7040 Red Cardinal Loop
- 7052 Red Cardinal Loop
- 7205 Pearly Heath Rd
- 7265 Pearly Heath Rd
- 7058 Red Cardinal Loop
- 7034 Red Cardinal Loop
- 7064 Red Cardinal Loop
- 7234 Pearly Heath Rd
- 6997 Red Cardinal Loop
- 7070 Red Cardinal Loop