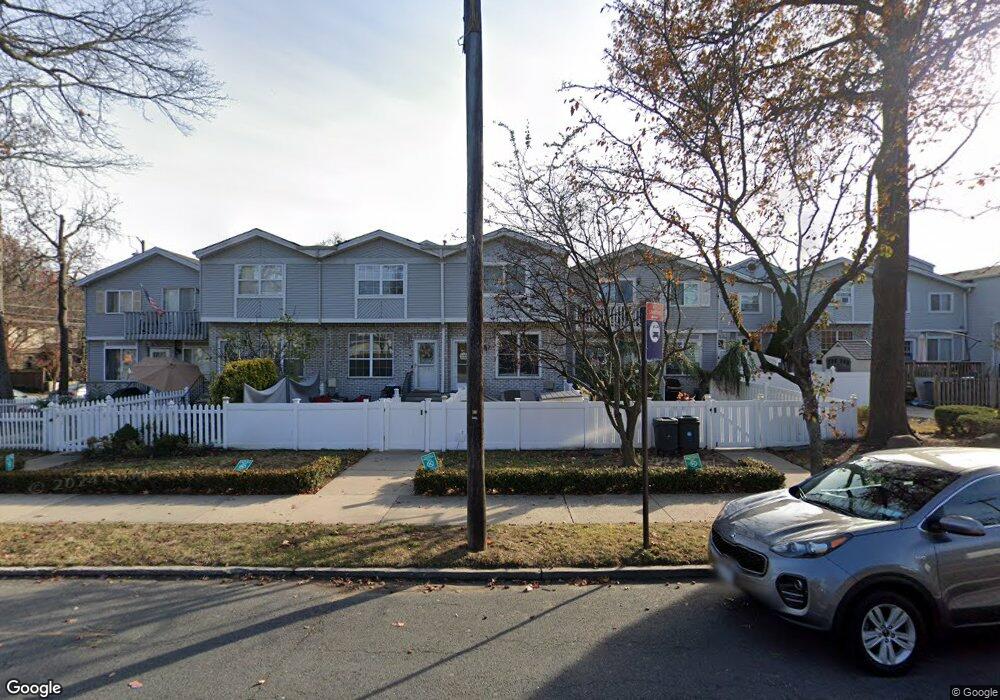
7046 Hylan Blvd Staten Island, NY 10307
Tottenville NeighborhoodEstimated Value: $497,632 - $581,000
2
Beds
1
Bath
832
Sq Ft
$633/Sq Ft
Est. Value
About This Home
This home is located at 7046 Hylan Blvd, Staten Island, NY 10307 and is currently estimated at $526,408, approximately $632 per square foot. 7046 Hylan Blvd is a home located in Richmond County with nearby schools including P.S. 6 Cpl Allan F Kivlehan School, Is 34 Tottenville, and Tottenville High School.
Ownership History
Date
Name
Owned For
Owner Type
Purchase Details
Closed on
Apr 11, 2022
Sold by
Newman Francine G
Bought by
Newman Francine and Newman Jamie Paige
Current Estimated Value
Home Financials for this Owner
Home Financials are based on the most recent Mortgage that was taken out on this home.
Original Mortgage
$225,000
Interest Rate
4.72%
Mortgage Type
New Conventional
Purchase Details
Closed on
Aug 30, 2005
Sold by
Green Daniel and Fasanella Lisa
Bought by
Newman Francine G
Home Financials for this Owner
Home Financials are based on the most recent Mortgage that was taken out on this home.
Original Mortgage
$160,000
Interest Rate
5.92%
Mortgage Type
Fannie Mae Freddie Mac
Purchase Details
Closed on
Mar 27, 2001
Sold by
Bryant Cheryl
Bought by
Green Daniel and Fasanella Lisa
Home Financials for this Owner
Home Financials are based on the most recent Mortgage that was taken out on this home.
Original Mortgage
$144,000
Interest Rate
6.88%
Create a Home Valuation Report for This Property
The Home Valuation Report is an in-depth analysis detailing your home's value as well as a comparison with similar homes in the area
Home Values in the Area
Average Home Value in this Area
Purchase History
| Date | Buyer | Sale Price | Title Company |
|---|---|---|---|
| Newman Francine | -- | Security Title | |
| Newman Francine G | $325,000 | First Amer Title Ins Co Ny | |
| Green Daniel | $180,000 | Commonwealth Land Title Ins |
Source: Public Records
Mortgage History
| Date | Status | Borrower | Loan Amount |
|---|---|---|---|
| Previous Owner | Newman Francine | $225,000 | |
| Previous Owner | Newman Francine G | $160,000 | |
| Previous Owner | Green Daniel | $144,000 |
Source: Public Records
Tax History Compared to Growth
Tax History
| Year | Tax Paid | Tax Assessment Tax Assessment Total Assessment is a certain percentage of the fair market value that is determined by local assessors to be the total taxable value of land and additions on the property. | Land | Improvement |
|---|---|---|---|---|
| 2025 | $3,347 | $29,700 | $2,802 | $26,898 |
| 2024 | $3,359 | $27,120 | $2,894 | $24,226 |
| 2023 | $3,384 | $19,526 | $2,778 | $16,748 |
| 2022 | $3,007 | $23,880 | $4,020 | $19,860 |
| 2021 | $2,967 | $22,860 | $4,020 | $18,840 |
| 2020 | $2,807 | $24,780 | $4,020 | $20,760 |
| 2019 | $2,600 | $21,540 | $4,020 | $17,520 |
| 2018 | $2,522 | $16,272 | $3,365 | $12,907 |
| 2017 | $2,786 | $16,149 | $3,705 | $12,444 |
| 2016 | $2,543 | $15,235 | $3,047 | $12,188 |
| 2015 | $2,136 | $14,373 | $2,970 | $11,403 |
| 2014 | $2,136 | $13,560 | $3,360 | $10,200 |
Source: Public Records
Map
Nearby Homes
- 57 Sunset Ln
- 220 Sprague Ave
- 320 Sprague Ave
- 327 Sprague Ave
- 539 Yetman Ave
- 329 George St
- 110 Surfside Plaza Unit 88
- 434 Yetman Ave
- 36 Adlers Ln
- 108 Surfside Plaza Unit 87
- 411 Yetman Ave
- 403 Yetman Ave
- 30 Paradise Place
- 660 Rockaway St
- 0 Minerva Ave Unit 495865
- 24 Sapphire Ct
- 61 Billop Ave
- 6 Kathleen Ct
- 284 Chelsea St
- 230 Bedell Ave