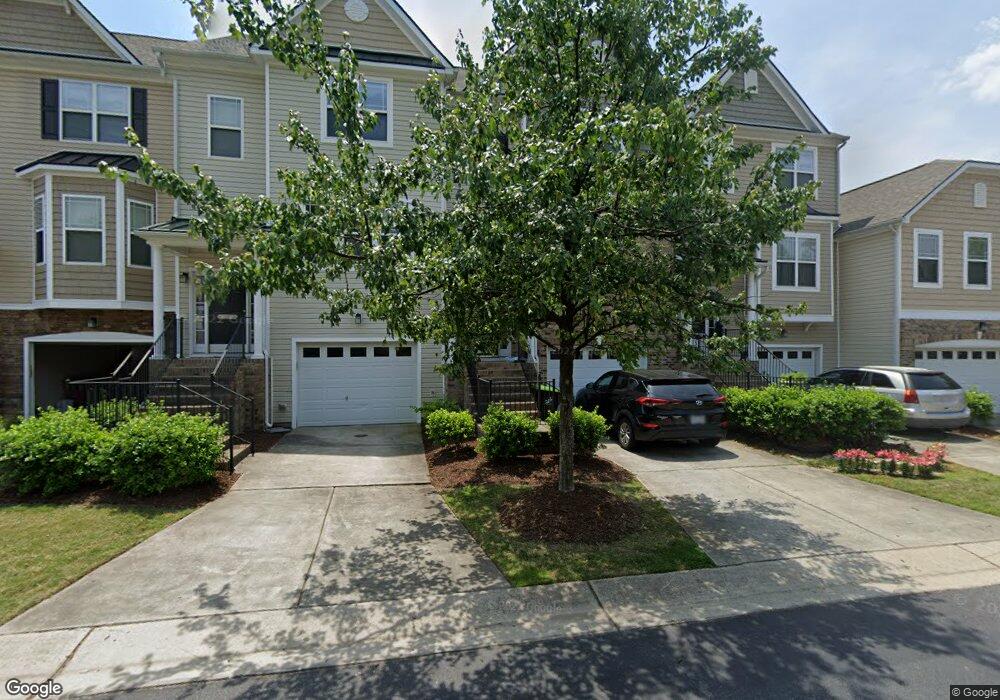
705-65 Keystone Park Unit 65 Morrisville, NC 27560
Estimated Value: $329,000 - $344,000
2
Beds
3
Baths
1,650
Sq Ft
$206/Sq Ft
Est. Value
About This Home
This home is located at 705-65 Keystone Park Unit 65, Morrisville, NC 27560 and is currently estimated at $339,793, approximately $205 per square foot. 705-65 Keystone Park Unit 65 is a home located in Durham County with nearby schools including Parkwood Elementary, Lowe's Grove Middle, and Hillside High School.
Ownership History
Date
Name
Owned For
Owner Type
Purchase Details
Closed on
Mar 5, 2019
Sold by
Secreta Of Veterans Affairs
Bought by
Sundaresan Kamal
Current Estimated Value
Home Financials for this Owner
Home Financials are based on the most recent Mortgage that was taken out on this home.
Original Mortgage
$147,750
Outstanding Balance
$129,897
Interest Rate
4.4%
Mortgage Type
New Conventional
Estimated Equity
$209,896
Purchase Details
Closed on
Jun 26, 2018
Sold by
Hawkins Chad A
Bought by
Freedom Mortgage Corporation
Purchase Details
Closed on
Jun 24, 2018
Sold by
Freedom Mortgage Corporation
Bought by
Secretary Of Veterans Affairs
Purchase Details
Closed on
Aug 12, 2014
Sold by
Hawkins Chad A
Bought by
Jones Family Holdings Llc
Purchase Details
Closed on
Dec 30, 2010
Sold by
Kb Home Raleigh Durham Inc
Bought by
Hawkins Chad A
Home Financials for this Owner
Home Financials are based on the most recent Mortgage that was taken out on this home.
Original Mortgage
$177,230
Interest Rate
4.42%
Mortgage Type
VA
Create a Home Valuation Report for This Property
The Home Valuation Report is an in-depth analysis detailing your home's value as well as a comparison with similar homes in the area
Home Values in the Area
Average Home Value in this Area
Purchase History
| Date | Buyer | Sale Price | Title Company |
|---|---|---|---|
| Sundaresan Kamal | -- | None Available | |
| Freedom Mortgage Corporation | $173,143 | None Available | |
| Secretary Of Veterans Affairs | -- | None Available | |
| Jones Family Holdings Llc | $4,890 | None Available | |
| Hawkins Chad A | $173,500 | None Available |
Source: Public Records
Mortgage History
| Date | Status | Borrower | Loan Amount |
|---|---|---|---|
| Open | Sundaresan Kamal | $147,750 | |
| Previous Owner | Hawkins Chad A | $177,230 |
Source: Public Records
Tax History Compared to Growth
Tax History
| Year | Tax Paid | Tax Assessment Tax Assessment Total Assessment is a certain percentage of the fair market value that is determined by local assessors to be the total taxable value of land and additions on the property. | Land | Improvement |
|---|---|---|---|---|
| 2025 | $2,912 | $379,545 | $80,000 | $299,545 |
| 2024 | $2,912 | $208,760 | $40,000 | $168,760 |
| 2023 | $2,735 | $208,760 | $40,000 | $168,760 |
| 2022 | $2,672 | $208,760 | $40,000 | $168,760 |
| 2021 | $2,659 | $208,760 | $40,000 | $168,760 |
| 2020 | $2,597 | $208,760 | $40,000 | $168,760 |
| 2019 | $2,597 | $208,760 | $40,000 | $168,760 |
| 2018 | $2,428 | $178,984 | $32,000 | $146,984 |
| 2017 | $2,410 | $178,984 | $32,000 | $146,984 |
| 2016 | $2,329 | $178,984 | $32,000 | $146,984 |
| 2015 | $2,528 | $182,591 | $34,100 | $148,491 |
| 2014 | $2,528 | $182,591 | $34,100 | $148,491 |
Source: Public Records
Map
Nearby Homes
- 732 Keystone Park Dr
- 4804 Trolley Ct
- 5780 S Miami Blvd
- 104 Mainline Station
- 1028 Brennan Green Ct
- 2949 Historic Cir
- 1004 Governess Ln
- 1025 Historic Cir
- 1144 Survada Ln
- 1148 Survada Ln
- 1404 Legendary Ln
- 1116 Crinoline Ln
- 2129 Glade Valley Ln
- 508 Durants Neck Ln
- 2122 Aventon Ln
- 2036 Aventon Ln
- 4511 Hopson Rd
- 4503 Hopson Rd
- 113 Lafferty St
- 1519 Chesterfield Ln
- 705 Keystone Park Dr
- 705 Keystone Park Dr
- 705-73 Keystone Park Dr
- 705 Keystone Park Dr
- 705 Keystone Park Dr
- 705 Keystone Park Dr
- 705 Keystone Park Dr
- 705-74 Keystone Park Dr Unit 315
- 705-74 Keystone Park Dr
- 705 Keystone Park Dr
- 705-56 Keystone Park Dr
- 705-56 Keystone Park Dr Unit 56
- 711-57 Keystone Park Dr Unit 250
- 711-57 Keystone Park Dr Unit 57
- 711.48 Keystone Park Dr
- 711-53 Keystone Park Dr
- 711-51 Keystone Park Dr
- 711-61 Keystone Park Dr Unit 248
- 711-59 Keystone Park Dr Unit 249
- 711-37 Keystone Park Dr