Estimated Value: $347,000 - $359,000
--
Bed
2
Baths
2,086
Sq Ft
$170/Sq Ft
Est. Value
About This Home
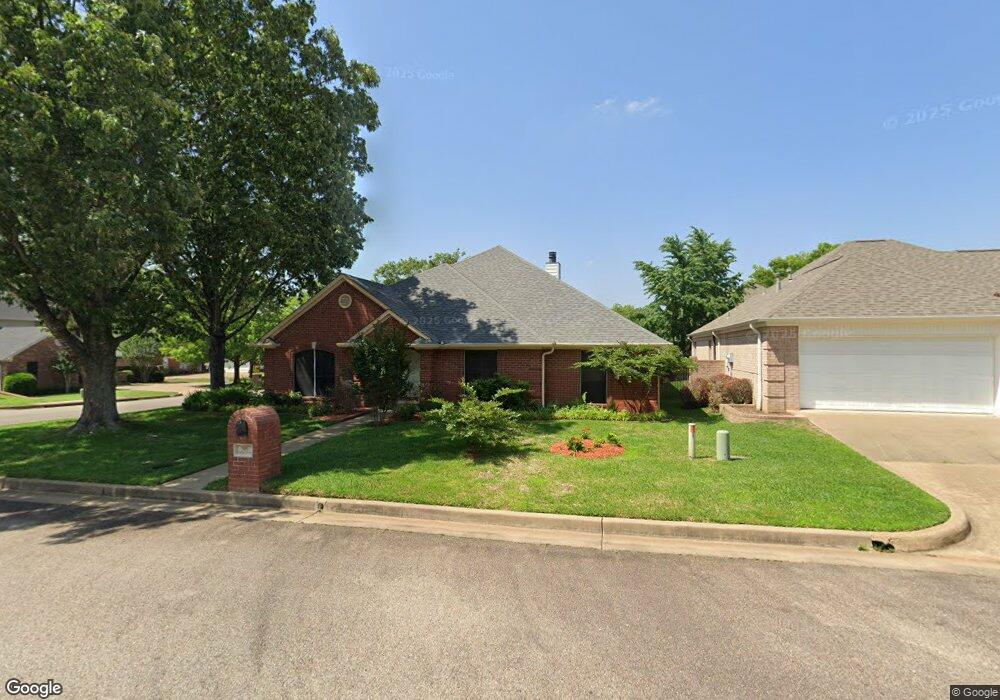
This home is located at 705 705 Paloma St, Tyler, TX 75703 and is currently estimated at $354,217, approximately $169 per square foot. 705 705 Paloma St is a home located in Smith County with nearby schools including Rice Elementary School, Hubbard Middle School, and Tyler Legacy High School.
Ownership History
Date
Name
Owned For
Owner Type
Purchase Details
Closed on
May 2, 2025
Sold by
Simpson Carolyn M
Bought by
Stokes James Ronald and Stokes Lucy E
Current Estimated Value
Home Financials for this Owner
Home Financials are based on the most recent Mortgage that was taken out on this home.
Original Mortgage
$267,750
Outstanding Balance
$266,325
Interest Rate
6.67%
Mortgage Type
New Conventional
Estimated Equity
$87,892
Purchase Details
Closed on
Oct 12, 2017
Sold by
Simpson Coroyn
Bought by
Simpson Merion
Purchase Details
Closed on
Nov 21, 2015
Sold by
Crawford Lamar S
Bought by
Simpson Merion and Simpson Carolyn
Purchase Details
Closed on
May 8, 2015
Sold by
Crawford Mildred M
Bought by
Crawford Lamar S and The Mildred M Crawford Family Trust
Create a Home Valuation Report for This Property
The Home Valuation Report is an in-depth analysis detailing your home's value as well as a comparison with similar homes in the area
Home Values in the Area
Average Home Value in this Area
Purchase History
| Date | Buyer | Sale Price | Title Company |
|---|---|---|---|
| Stokes James Ronald | -- | None Listed On Document | |
| Simpson Merion | -- | None Available | |
| Simpson Merion | -- | None Available | |
| Crawford Lamar S | -- | None Available |
Source: Public Records
Mortgage History
| Date | Status | Borrower | Loan Amount |
|---|---|---|---|
| Open | Stokes James Ronald | $267,750 |
Source: Public Records
Tax History Compared to Growth
Tax History
| Year | Tax Paid | Tax Assessment Tax Assessment Total Assessment is a certain percentage of the fair market value that is determined by local assessors to be the total taxable value of land and additions on the property. | Land | Improvement |
|---|---|---|---|---|
| 2025 | $3,490 | $331,133 | $28,692 | $302,441 |
| 2024 | $3,490 | $328,827 | $47,849 | $310,938 |
| 2023 | $5,211 | $338,262 | $47,849 | $290,413 |
| 2022 | $5,324 | $271,758 | $39,427 | $232,331 |
| 2021 | $6,028 | $291,081 | $39,427 | $251,654 |
| 2020 | $5,589 | $281,326 | $39,427 | $241,899 |
| 2019 | $5,193 | $237,462 | $38,279 | $199,183 |
| 2018 | $4,814 | $221,319 | $38,279 | $183,040 |
| 2017 | $4,725 | $221,319 | $38,279 | $183,040 |
| 2016 | $4,543 | $212,798 | $38,279 | $174,519 |
| 2015 | $2,366 | $208,911 | $38,279 | $170,632 |
| 2014 | $2,366 | $197,170 | $38,279 | $158,891 |
Source: Public Records
Map
Nearby Homes
- 704 Paloma St
- 5106 Cloverdale Dr
- 802 Carriage Dr
- 601 Carriage Dr
- 842 Carriage Dr
- 709 Top Hill Dr
- 608 Top Hill Dr
- 717 Meadow Creek Dr
- 1107 Larkspur Ln
- 5401 Hollytree Dr
- 5401 Hollytree Dr Unit 1002
- 709 W Rieck Rd
- 1202 Rice Rd
- 7434 Waterview Square
- 6052 N Park Central Ct
- 5802 Briar Creek Dr
- 1408 Woodbridge Dr
- 418 Boyd Ln
- 1212 Parkview Dr
- 716 Chimney Rock Dr
- 703 Paloma St
- 706 Shiloh Ridge St
- 704 Shiloh Ridge St
- 701 Paloma St
- 5109 5109 Katie Dr
- 5109 Katie Dr
- 5111 Katie Dr
- 706 Paloma St
- 702 702 Shiloh Ridge St
- 702 Shiloh Ridge St
- 5111 5111 Katie Dr
- 702 Paloma St
- 708 Paloma St
- 5203 Katie Dr
- 5107 Katie Dr
- 702 702 Paloma
- 609 Paloma St
- 5107 5107 Katie Dr
- 608 Shiloh Ridge St
- 608 608 Shiloh Ridge