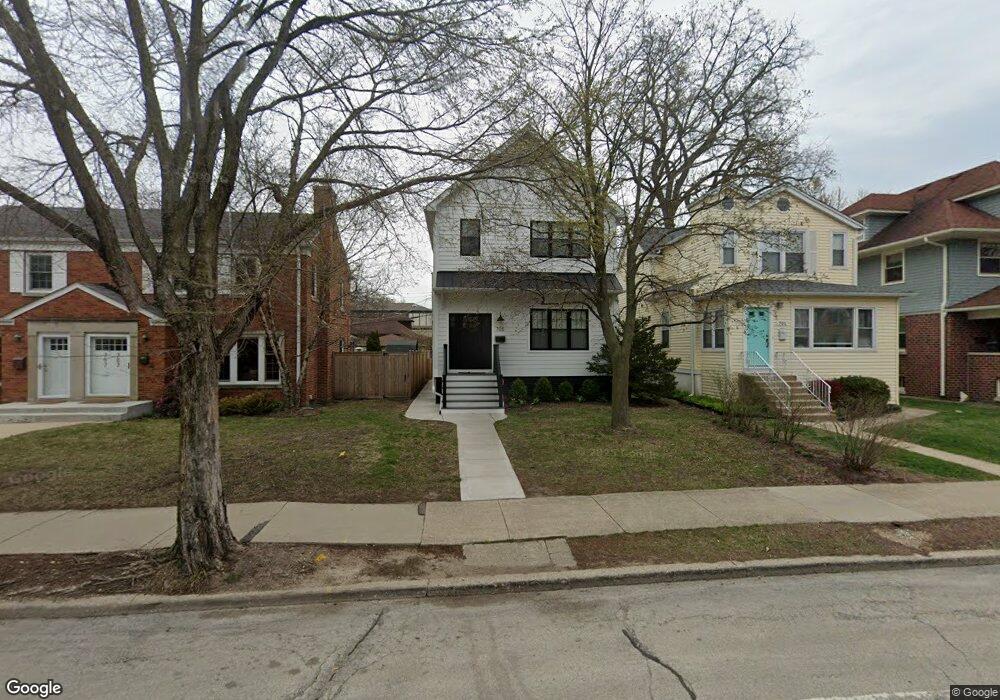
705 Asbury Ave Evanston, IL 60202
Southwest Evanston NeighborhoodEstimated Value: $566,000 - $662,000
3
Beds
2
Baths
2,275
Sq Ft
$265/Sq Ft
Est. Value
About This Home
This home is located at 705 Asbury Ave, Evanston, IL 60202 and is currently estimated at $602,870, approximately $264 per square foot. 705 Asbury Ave is a home located in Cook County with nearby schools including Oakton Elementary School, Chute Middle School, and Evanston Township High School.
Ownership History
Date
Name
Owned For
Owner Type
Purchase Details
Closed on
Sep 29, 2008
Sold by
Atlas Howard C and Atlas Gail T
Bought by
Bowers Mark J and Bowers Heidi N
Current Estimated Value
Home Financials for this Owner
Home Financials are based on the most recent Mortgage that was taken out on this home.
Original Mortgage
$369,550
Outstanding Balance
$241,464
Interest Rate
6.41%
Mortgage Type
Purchase Money Mortgage
Estimated Equity
$361,406
Purchase Details
Closed on
Oct 15, 2001
Sold by
Spencer Christopher W and Spencer Gayleen A
Bought by
Atlas Howard C and Spencer Gayleen A
Home Financials for this Owner
Home Financials are based on the most recent Mortgage that was taken out on this home.
Original Mortgage
$216,000
Interest Rate
6.62%
Purchase Details
Closed on
Feb 26, 1999
Sold by
Draths James A and Draths Karen R
Bought by
Spencer Christopher W and Spencer Gayleen
Home Financials for this Owner
Home Financials are based on the most recent Mortgage that was taken out on this home.
Original Mortgage
$165,600
Interest Rate
6.92%
Create a Home Valuation Report for This Property
The Home Valuation Report is an in-depth analysis detailing your home's value as well as a comparison with similar homes in the area
Home Values in the Area
Average Home Value in this Area
Purchase History
| Date | Buyer | Sale Price | Title Company |
|---|---|---|---|
| Bowers Mark J | $389,000 | Centennial Title Inc | |
| Atlas Howard C | $270,000 | -- | |
| Spencer Christopher W | $184,000 | -- |
Source: Public Records
Mortgage History
| Date | Status | Borrower | Loan Amount |
|---|---|---|---|
| Open | Bowers Mark J | $369,550 | |
| Previous Owner | Atlas Howard C | $216,000 | |
| Previous Owner | Spencer Christopher W | $165,600 | |
| Closed | Atlas Howard C | $40,500 |
Source: Public Records
Tax History
| Year | Tax Paid | Tax Assessment Tax Assessment Total Assessment is a certain percentage of the fair market value that is determined by local assessors to be the total taxable value of land and additions on the property. | Land | Improvement |
|---|---|---|---|---|
| 2025 | $10,883 | $68,000 | $15,802 | $52,198 |
| 2024 | $10,883 | $55,188 | $13,580 | $41,608 |
| 2023 | $10,416 | $55,188 | $13,580 | $41,608 |
| 2022 | $10,416 | $55,188 | $13,580 | $41,608 |
| 2021 | $8,538 | $35,077 | $7,900 | $27,177 |
| 2020 | $8,482 | $35,077 | $7,900 | $27,177 |
| 2019 | $8,156 | $37,792 | $7,900 | $29,892 |
| 2018 | $5,912 | $23,506 | $6,666 | $16,840 |
| 2017 | $7,958 | $32,816 | $6,666 | $26,150 |
| 2016 | $9,321 | $38,862 | $6,666 | $32,196 |
| 2015 | $7,042 | $28,519 | $5,555 | $22,964 |
| 2014 | $7,629 | $30,895 | $5,555 | $25,340 |
| 2013 | $7,437 | $30,895 | $5,555 | $25,340 |
Source: Public Records
Map
Nearby Homes
- SAN JUAN GRANDE La Cascabela
- 553 Barton Ave
- 1507 Cleveland St
- 1515 Monroe St Unit A
- 1314 Main St Unit 2D
- 532 Wesley Ave Unit WEST
- 1520 Washington St
- 835 Ridge Ave Unit 103
- 1315 Main St
- 704 Florence Ave
- 517 Elmwood Ave
- 439 Ridge Ave Unit 2
- 1003 Wesley Ave
- 1217 Hull Terrace Unit 3A
- 828 Oakton St Unit 3F
- 1025 Wesley Ave
- 820 Oakton St Unit 2C
- 1815 Cleveland St
- 1810 Washington St
- 701 Reba Place
- 701 Asbury Ave
- 707 Asbury Ave
- 709 Asbury Ave
- 1220 Monroe St
- 649 Asbury Ave
- 1216 Monroe St
- 647 Asbury Ave
- 647 Asbury Ave Unit 2
- 647 Asbury Ave Unit 1
- 1212 Monroe St
- 1215 Cleveland St
- 639 Asbury Ave
- 715 Asbury Ave
- 1210 Monroe St
- 1211 Cleveland St
- 1208 Monroe St
- 706 Asbury Ave
- 702 Asbury Ave
- 1207 Cleveland St
- 717 Asbury Ave
Your Personal Tour Guide
Ask me questions while you tour the home.