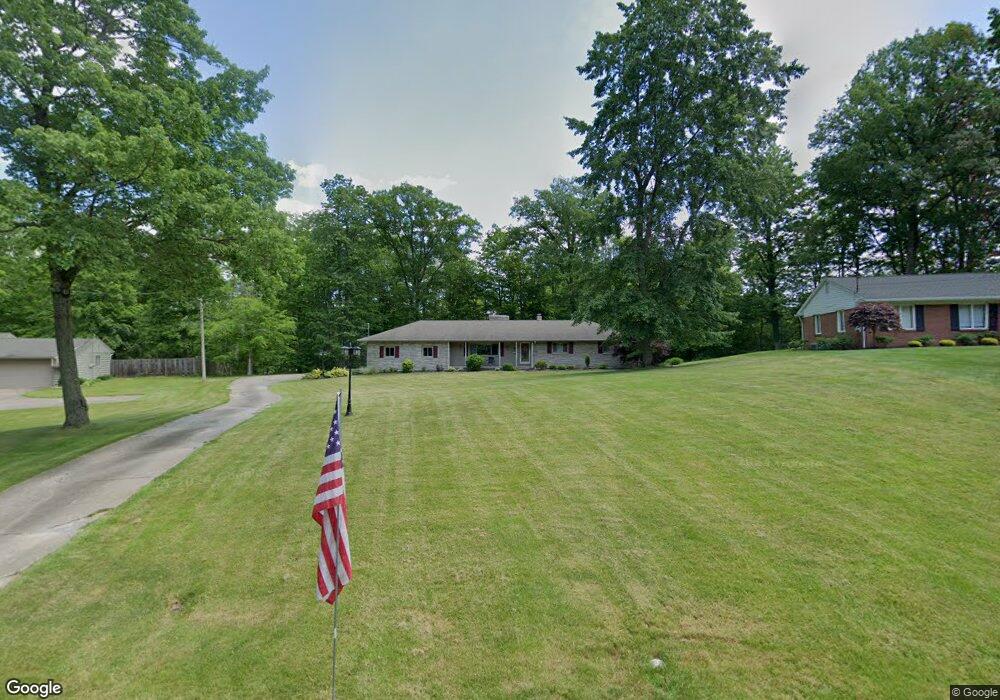
705 Blueberry Hill Dr Canfield, OH 44406
Estimated Value: $293,000 - $314,000
3
Beds
2
Baths
1,837
Sq Ft
$164/Sq Ft
Est. Value
About This Home
This home is located at 705 Blueberry Hill Dr, Canfield, OH 44406 and is currently estimated at $301,572, approximately $164 per square foot. 705 Blueberry Hill Dr is a home located in Mahoning County with nearby schools including Canfield Village Middle School and Canfield High School.
Ownership History
Date
Name
Owned For
Owner Type
Purchase Details
Closed on
May 20, 2010
Sold by
Hively Ryan J and Hively Nicole M
Bought by
Rich David W and Rich Karen Y
Current Estimated Value
Home Financials for this Owner
Home Financials are based on the most recent Mortgage that was taken out on this home.
Original Mortgage
$124,400
Outstanding Balance
$82,378
Interest Rate
5.12%
Mortgage Type
New Conventional
Estimated Equity
$219,194
Purchase Details
Closed on
Apr 18, 2005
Sold by
Schrom Kenneth H and Schrom Eleanor
Bought by
Hively Ryan J and Hively Nicole M
Home Financials for this Owner
Home Financials are based on the most recent Mortgage that was taken out on this home.
Original Mortgage
$90,000
Interest Rate
6.05%
Mortgage Type
Fannie Mae Freddie Mac
Purchase Details
Closed on
Sep 24, 1992
Bought by
Marriott Esther K
Create a Home Valuation Report for This Property
The Home Valuation Report is an in-depth analysis detailing your home's value as well as a comparison with similar homes in the area
Home Values in the Area
Average Home Value in this Area
Purchase History
| Date | Buyer | Sale Price | Title Company |
|---|---|---|---|
| Rich David W | $155,500 | Attorney | |
| Hively Ryan J | $112,500 | -- | |
| Marriott Esther K | -- | -- |
Source: Public Records
Mortgage History
| Date | Status | Borrower | Loan Amount |
|---|---|---|---|
| Open | Rich David W | $124,400 | |
| Previous Owner | Hively Ryan J | $90,000 |
Source: Public Records
Tax History
| Year | Tax Paid | Tax Assessment Tax Assessment Total Assessment is a certain percentage of the fair market value that is determined by local assessors to be the total taxable value of land and additions on the property. | Land | Improvement |
|---|---|---|---|---|
| 2025 | $3,472 | $90,710 | $16,450 | $74,260 |
| 2024 | $3,488 | $90,710 | $16,450 | $74,260 |
| 2023 | $3,459 | $90,710 | $16,450 | $74,260 |
| 2022 | $2,749 | $60,300 | $14,600 | $45,700 |
| 2021 | $2,668 | $60,300 | $14,600 | $45,700 |
| 2020 | $2,679 | $60,300 | $14,600 | $45,700 |
| 2019 | $2,502 | $52,430 | $12,690 | $39,740 |
| 2018 | $2,471 | $52,430 | $12,690 | $39,740 |
| 2017 | $2,468 | $52,430 | $12,690 | $39,740 |
| 2016 | $2,294 | $50,100 | $12,690 | $37,410 |
| 2015 | $2,243 | $50,100 | $12,690 | $37,410 |
| 2014 | $2,252 | $50,100 | $12,690 | $37,410 |
| 2013 | $2,171 | $50,100 | $12,690 | $37,410 |
Source: Public Records
Map
Nearby Homes
- 675 Blueberry Hill Dr
- 492 Hickory Hollow Dr
- 68 Timber Run Dr
- 52 Lakhani Ln
- 90 Villa Theresa Ln
- 91 Villa Theresa Ln
- 80 Villa Theresa Ln
- 81 Villa Theresa Ln
- 71 Villa Theresa Ln
- 21 Timber Run Ct
- 61 Villa Theresa Ln
- 51 Villa Theresa Ln
- 41 Villa Theresa Ln
- 30 Villa Theresa Ln
- 31 Villa Theresa Ln
- 20 Villa Theresa Ln
- 9 Willow Way
- 21 Villa Theresa Ln
- 10 Villa Theresa Ln
- 317 Verdant Ln
- 715 Blueberry Hill Dr
- 685 Blueberry Hill Dr
- 605 Hickory Hollow Dr
- 35 Camelot Ct
- 700 Blueberry Hill Dr
- 25 Camelot Ct
- 720 Blueberry Hill Dr
- 595 Hickory Hollow Dr
- 725 Blueberry Hill Dr
- 690 Blueberry Hill Dr
- 289 Sawmill Run Dr
- 45 Camelot Ct
- 680 Blueberry Hill Dr
- 585 Hickory Hollow Dr
- 735 Blueberry Hill Dr
- 600 Hickory Hollow Dr
- 665 Blueberry Hill Dr
- 740 Blueberry Hill Dr
- 281 Sawmill Run Dr
- 670 Blueberry Hill Dr
Your Personal Tour Guide
Ask me questions while you tour the home.