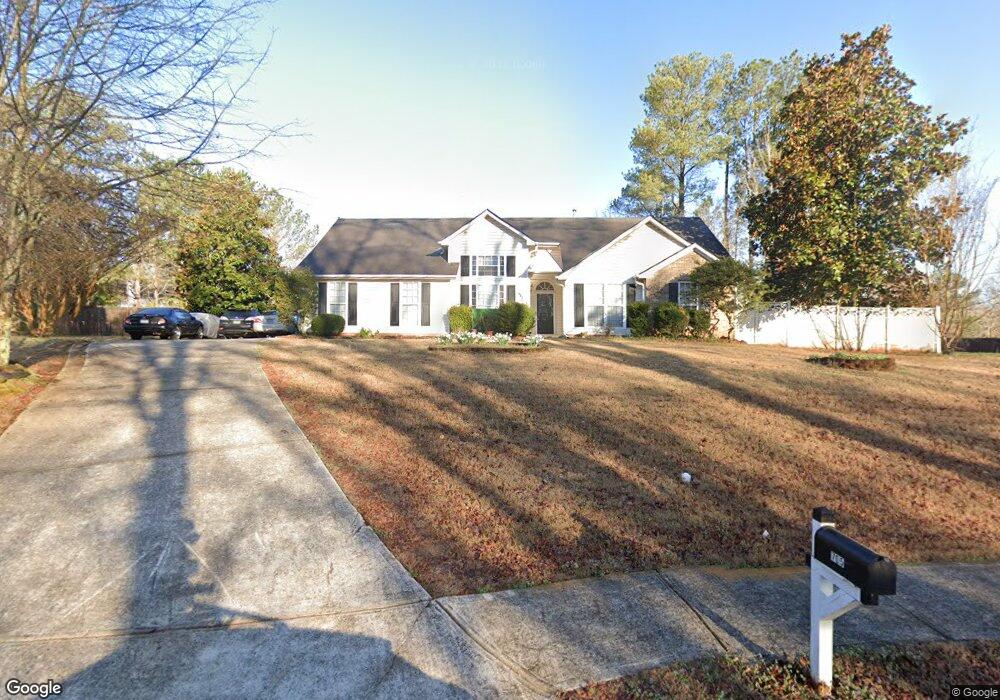
705 Chaseridge Dr Unit 3 McDonough, GA 30253
Estimated Value: $282,000 - $299,000
3
Beds
2
Baths
1,664
Sq Ft
$175/Sq Ft
Est. Value
About This Home
This home is located at 705 Chaseridge Dr Unit 3, McDonough, GA 30253 and is currently estimated at $290,795, approximately $174 per square foot. 705 Chaseridge Dr Unit 3 is a home located in Henry County with nearby schools including Flippen Elementary School, Eagle's Landing Middle School, and Eagle's Landing High School.
Ownership History
Date
Name
Owned For
Owner Type
Purchase Details
Closed on
Jul 19, 2007
Sold by
Torres Carmen M
Bought by
Morris Patricia E
Current Estimated Value
Home Financials for this Owner
Home Financials are based on the most recent Mortgage that was taken out on this home.
Original Mortgage
$132,000
Outstanding Balance
$100,692
Interest Rate
11.34%
Mortgage Type
New Conventional
Estimated Equity
$190,103
Purchase Details
Closed on
Aug 8, 2003
Sold by
Pearl Tareasa M
Bought by
Torres Carmen M
Home Financials for this Owner
Home Financials are based on the most recent Mortgage that was taken out on this home.
Original Mortgage
$65,000
Interest Rate
6.45%
Mortgage Type
New Conventional
Purchase Details
Closed on
Apr 21, 1999
Sold by
Key Homes Ins
Bought by
Pearl Tareasa M
Home Financials for this Owner
Home Financials are based on the most recent Mortgage that was taken out on this home.
Original Mortgage
$118,338
Interest Rate
7.13%
Mortgage Type
New Conventional
Create a Home Valuation Report for This Property
The Home Valuation Report is an in-depth analysis detailing your home's value as well as a comparison with similar homes in the area
Home Values in the Area
Average Home Value in this Area
Purchase History
| Date | Buyer | Sale Price | Title Company |
|---|---|---|---|
| Morris Patricia E | $165,000 | -- | |
| Torres Carmen M | $139,900 | -- | |
| Pearl Tareasa M | $119,900 | -- |
Source: Public Records
Mortgage History
| Date | Status | Borrower | Loan Amount |
|---|---|---|---|
| Open | Morris Patricia E | $132,000 | |
| Previous Owner | Torres Carmen M | $65,000 | |
| Previous Owner | Pearl Tareasa M | $118,338 |
Source: Public Records
Tax History Compared to Growth
Tax History
| Year | Tax Paid | Tax Assessment Tax Assessment Total Assessment is a certain percentage of the fair market value that is determined by local assessors to be the total taxable value of land and additions on the property. | Land | Improvement |
|---|---|---|---|---|
| 2025 | $3,354 | $117,320 | $16,000 | $101,320 |
| 2024 | $3,354 | $116,680 | $16,000 | $100,680 |
| 2023 | $2,963 | $118,320 | $14,000 | $104,320 |
| 2022 | $2,794 | $89,800 | $14,000 | $75,800 |
| 2021 | $2,399 | $73,040 | $14,000 | $59,040 |
| 2020 | $2,173 | $63,480 | $12,000 | $51,480 |
| 2019 | $2,091 | $60,000 | $10,000 | $50,000 |
| 2018 | $1,988 | $56,960 | $10,000 | $46,960 |
| 2016 | $1,675 | $48,800 | $8,000 | $40,800 |
| 2015 | $1,558 | $44,800 | $8,000 | $36,800 |
| 2014 | $1,433 | $41,320 | $8,000 | $33,320 |
Source: Public Records
Map
Nearby Homes
- 682 Monticello Ln
- 340 Heavenly Hollow Place
- 332 Heavenly Hollow Place
- 337 Heavenly Hollow Place
- 349 Heavenly Hollow Place
- 220 Daileys Plantation Dr
- 619 Leafy Branch Way
- 615 Leafy Branch Way
- 660 Leafy Branch Way
- 648 Leafy Branch Way
- 604 Way
- 643 Leafy Branch Way
- 604 Leafy Branch Way
- 656 Leafy Branch Way
- 686 Dailey Mill Rd
- 250 Daileys Plantation Dr
- Wynwood Plan at Bowers Farm - Single Family Homes
- Wagener Plan at Bowers Farm - Single Family Homes
- Pelham Plan at Bowers Farm - Single Family Homes
- Ridgewood Plan at Bowers Farm - Single Family Homes
- 695 Chaseridge Dr
- 715 Chaseridge Dr
- 785 Chaseridge Dr
- 775 Chaseridge Dr Unit 112
- 775 Chaseridge Dr
- 685 Chaseridge Dr Unit 117
- 685 Chaseridge Dr
- 685 Chaseridge Dr
- 865 Chaseridge Dr
- 855 Chaseridge Dr
- 725 Chaseridge Dr Unit III
- 845 Chaseridge Dr
- 795 Chaseridge Dr
- 675 Chaseridge Dr Unit III
- 710 Chaseridge Dr Unit 3
- 875 Chaseridge Dr
- 670 Chase Ridge Dr
- 670 Chaseridge Dr
- 720 Chaseridge Dr Unit 3
- 790 Chaseridge Dr