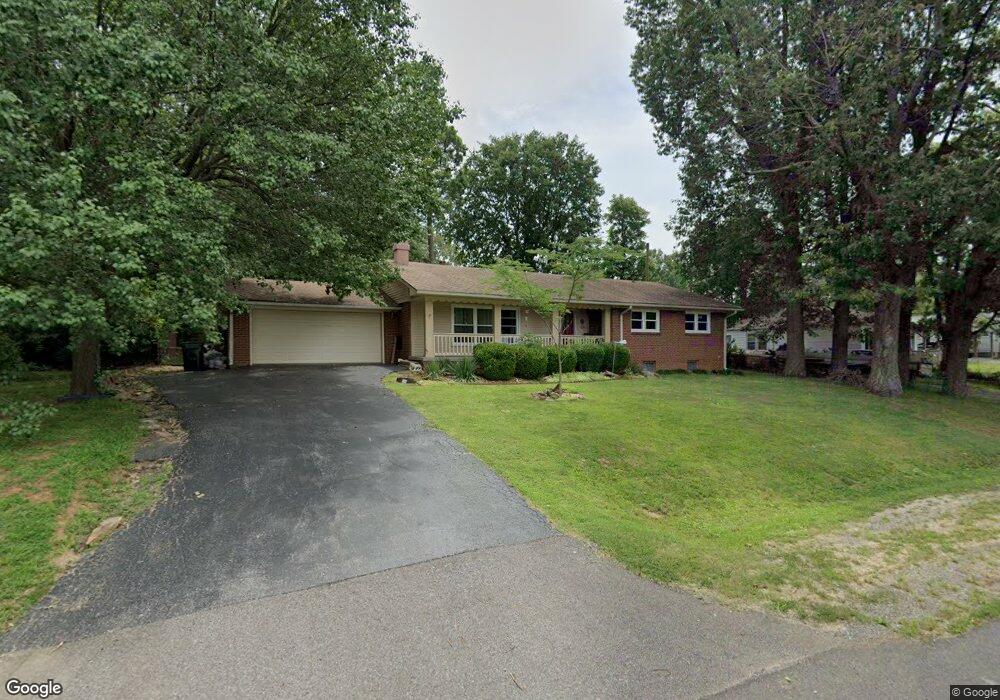
705 Cherry St Calvert City, KY 42029
Estimated Value: $145,000 - $169,000
3
Beds
2
Baths
1,734
Sq Ft
$91/Sq Ft
Est. Value
About This Home
This home is located at 705 Cherry St, Calvert City, KY 42029 and is currently estimated at $156,953, approximately $90 per square foot. 705 Cherry St is a home located in Marshall County with nearby schools including Calvert City Elementary School, North Marshall Middle School, and Marshall County High School.
Ownership History
Date
Name
Owned For
Owner Type
Purchase Details
Closed on
May 5, 2023
Sold by
Taylor Thomas A
Bought by
Burch Jackson and Burch Emily
Current Estimated Value
Home Financials for this Owner
Home Financials are based on the most recent Mortgage that was taken out on this home.
Original Mortgage
$137,464
Outstanding Balance
$130,961
Interest Rate
6.43%
Mortgage Type
New Conventional
Estimated Equity
$25,992
Purchase Details
Closed on
Nov 3, 2017
Sold by
Lyles William Bruce and Lyles Wendy Dawn
Bought by
Taylor Thomas A
Home Financials for this Owner
Home Financials are based on the most recent Mortgage that was taken out on this home.
Original Mortgage
$85,775
Interest Rate
5.5%
Mortgage Type
FHA
Create a Home Valuation Report for This Property
The Home Valuation Report is an in-depth analysis detailing your home's value as well as a comparison with similar homes in the area
Home Values in the Area
Average Home Value in this Area
Purchase History
| Date | Buyer | Sale Price | Title Company |
|---|---|---|---|
| Burch Jackson | $140,000 | None Listed On Document | |
| Burch Jackson | $140,000 | None Listed On Document | |
| Taylor Thomas A | $92,000 | None Available |
Source: Public Records
Mortgage History
| Date | Status | Borrower | Loan Amount |
|---|---|---|---|
| Open | Burch Jackson | $137,464 | |
| Closed | Burch Jackson | $137,464 | |
| Previous Owner | Taylor Thomas A | $85,775 |
Source: Public Records
Tax History
| Year | Tax Paid | Tax Assessment Tax Assessment Total Assessment is a certain percentage of the fair market value that is determined by local assessors to be the total taxable value of land and additions on the property. | Land | Improvement |
|---|---|---|---|---|
| 2025 | $1,151 | $140,000 | $12,000 | $128,000 |
| 2024 | $1,166 | $140,000 | $12,000 | $128,000 |
| 2023 | $986 | $114,000 | $10,000 | $104,000 |
| 2022 | $1,027 | $114,000 | $10,000 | $104,000 |
| 2021 | $839 | $92,000 | $9,000 | $83,000 |
| 2020 | $844 | $92,000 | $9,000 | $83,000 |
| 2019 | $844 | $92,000 | $9,000 | $83,000 |
| 2018 | $846 | $92,000 | $9,000 | $83,000 |
| 2017 | $326 | $73,000 | $8,000 | $65,000 |
| 2016 | $250 | $64,100 | $7,500 | $56,600 |
| 2015 | $252 | $64,100 | $7,500 | $56,600 |
| 2014 | $259 | $64,100 | $0 | $0 |
| 2010 | -- | $64,100 | $7,500 | $56,600 |
Source: Public Records
Map
Nearby Homes
- 635 E 6th Ave
- 641 Elder St
- 587 Elder St
- 658 E 5th Ave
- 581 S Main St
- 188 Princess Jennifer Dr
- 770 Juniper St
- 1041 S Main St
- 808 Oak Park Blvd
- 1532 Oak Park Blvd
- 00 Lawson Johnston Subdivision Unit Lots 51-54, 68-71, &
- 1339 Colorado St
- 4300 U S 62
- 300 Scillion Dr
- 000 Lone Valley Rd
- Lot 24 Ford Square Dr
- Lot 8 Ford Square Dr
- Lot 15 Ford Square Dr
- Lot 19 Ford Square Dr
- Lot 21 Ford Square Dr
Your Personal Tour Guide
Ask me questions while you tour the home.