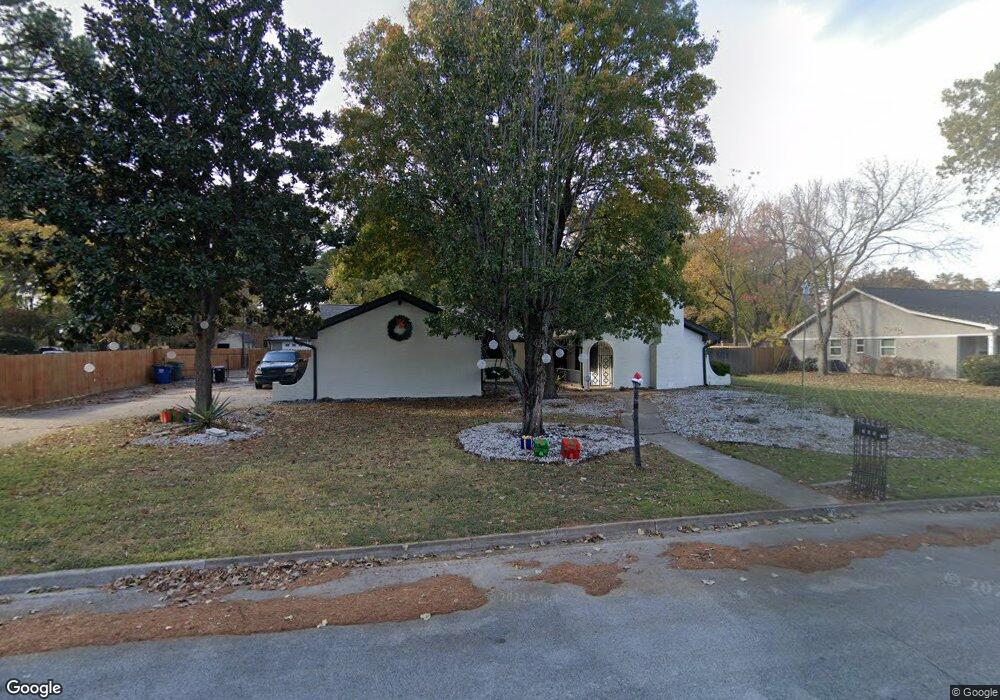
705 Cimarron Trail Southlake, TX 76092
Estimated Value: $537,642 - $623,000
4
Beds
2
Baths
1,926
Sq Ft
$304/Sq Ft
Est. Value
About This Home
This home is located at 705 Cimarron Trail, Southlake, TX 76092 and is currently estimated at $586,161, approximately $304 per square foot. 705 Cimarron Trail is a home located in Tarrant County with nearby schools including Florence Elementary School, Bear Creek Intermediate School, and Keller Middle School.
Ownership History
Date
Name
Owned For
Owner Type
Purchase Details
Closed on
Jan 8, 2020
Sold by
Mcchesnee Geraldine and Johnson Debra J
Bought by
Garmon James Michael and Peak Tara Marie
Current Estimated Value
Home Financials for this Owner
Home Financials are based on the most recent Mortgage that was taken out on this home.
Original Mortgage
$280,000
Outstanding Balance
$247,391
Interest Rate
3.6%
Mortgage Type
New Conventional
Estimated Equity
$338,770
Purchase Details
Closed on
May 15, 2007
Sold by
Daniel Charlene Rene
Bought by
Smith Jerry C
Purchase Details
Closed on
Dec 4, 2006
Sold by
Daniel Charlene Rene
Bought by
Smith Jerry C
Purchase Details
Closed on
Jul 28, 2004
Sold by
Daniel Charlene Rene
Bought by
Daniel Charlene Rene
Purchase Details
Closed on
Mar 1, 1996
Sold by
Daniel Charlene
Bought by
Daniel Marvin
Create a Home Valuation Report for This Property
The Home Valuation Report is an in-depth analysis detailing your home's value as well as a comparison with similar homes in the area
Home Values in the Area
Average Home Value in this Area
Purchase History
| Date | Buyer | Sale Price | Title Company |
|---|---|---|---|
| Garmon James Michael | -- | Trinity Title | |
| Smith Jerry C | -- | None Available | |
| Smith Jerry C | -- | None Available | |
| Daniel Charlene Rene | -- | -- | |
| Daniel Marvin | -- | -- |
Source: Public Records
Mortgage History
| Date | Status | Borrower | Loan Amount |
|---|---|---|---|
| Open | Garmon James Michael | $280,000 |
Source: Public Records
Tax History Compared to Growth
Tax History
| Year | Tax Paid | Tax Assessment Tax Assessment Total Assessment is a certain percentage of the fair market value that is determined by local assessors to be the total taxable value of land and additions on the property. | Land | Improvement |
|---|---|---|---|---|
| 2025 | $5,859 | $400,000 | $181,120 | $218,880 |
| 2024 | $5,859 | $400,000 | $181,120 | $218,880 |
| 2023 | $7,345 | $537,707 | $140,000 | $397,707 |
| 2022 | $7,740 | $350,000 | $70,000 | $280,000 |
| 2021 | $8,359 | $350,000 | $70,000 | $280,000 |
| 2020 | $8,099 | $336,510 | $70,000 | $266,510 |
| 2019 | $8,126 | $318,481 | $70,000 | $248,481 |
| 2018 | $3,226 | $290,690 | $70,000 | $220,690 |
| 2017 | $6,894 | $316,450 | $70,000 | $246,450 |
| 2016 | $6,267 | $299,532 | $70,000 | $229,532 |
| 2015 | $3,208 | $218,400 | $40,000 | $178,400 |
| 2014 | $3,208 | $218,400 | $40,000 | $178,400 |
Source: Public Records
Map
Nearby Homes
- 700 Overland Trail
- 2912 Sutton Place
- 600 Overland Trail
- 605 Royal Ln
- 2021 Vista Rd
- 605 Castleman Ct
- 3095 Johnson Rd
- 2004 Vista View Rd
- 146 Jellico Cir
- 1925 Florence Rd
- 3210 Gray Ln
- 404 Branding Iron Ct
- 2655 Johnson Rd
- Maverick Plan at Winding Creek
- Cypress Plan at Winding Creek
- Athens Plan at Winding Creek
- 1816 Johnson Rd
- Livingston Plan at Winding Creek
- Franklin Plan at Winding Creek
- Sandhill Plan at Winding Creek
- 709 Cimarron Trail
- 701 Cimarron Trail
- 713 Cimarron Trail
- 704 Cimarron Trail
- 629 Cimarron Trail
- 708 Cimarron Trail
- 3160 Johnson Rd
- 1607 N Pearson Ln
- 712 Cimarron Trail
- 628 Cimarron Trail
- 717 Cimarron Trail
- 625 Cimarron Trail
- 705 Overland Trail
- 701 Overland Trail
- 3150 Johnson Rd
- 716 Cimarron Trail
- 709 Overland Trail
- 1605 N Pearson Ln
- 721 Cimarron Trail
- 629 Overland Trail