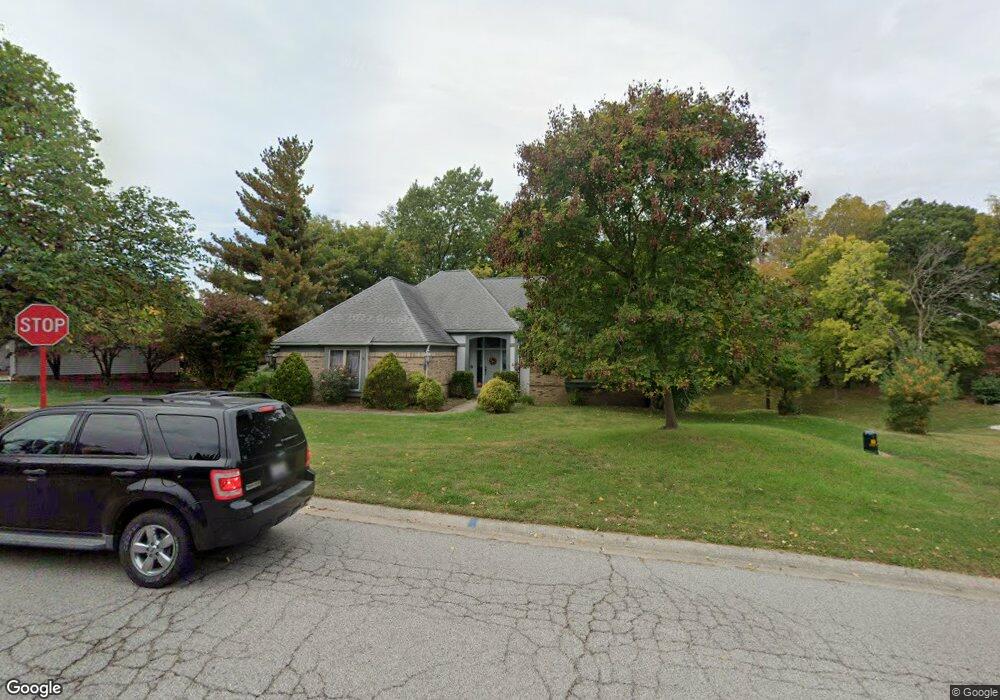
705 Deer Run Rd Belleville, IL 62223
Estimated Value: $375,075 - $446,000
4
Beds
3
Baths
1,949
Sq Ft
$208/Sq Ft
Est. Value
About This Home
This home is located at 705 Deer Run Rd, Belleville, IL 62223 and is currently estimated at $406,019, approximately $208 per square foot. 705 Deer Run Rd is a home located in St. Clair County with nearby schools including Ellis Elementary School, Emge Junior High School, and Blessed Sacrament Catholic School.
Ownership History
Date
Name
Owned For
Owner Type
Purchase Details
Closed on
Jan 3, 2023
Sold by
Letner Cynthia and Karch Family Trust Karch Family Trust
Bought by
Letner Terrence and Letner Family Trust
Current Estimated Value
Purchase Details
Closed on
Jun 29, 2011
Sold by
Karch Mary Anne
Bought by
Karch William G and Karch Mary Anne
Purchase Details
Closed on
Feb 18, 2005
Sold by
Carley Thomas G and Carley Thomas G
Bought by
Karch Mary Anne
Purchase Details
Closed on
Jul 9, 2003
Sold by
Carley Angela M
Bought by
Carley Thomas G and Carley Ii Thomas G
Purchase Details
Closed on
May 4, 2002
Sold by
Wyers Stephan G and Wyers Mary R
Bought by
Carley Thomas G and Carley Angela M
Home Financials for this Owner
Home Financials are based on the most recent Mortgage that was taken out on this home.
Original Mortgage
$247,950
Interest Rate
7.18%
Create a Home Valuation Report for This Property
The Home Valuation Report is an in-depth analysis detailing your home's value as well as a comparison with similar homes in the area
Home Values in the Area
Average Home Value in this Area
Purchase History
| Date | Buyer | Sale Price | Title Company |
|---|---|---|---|
| Letner Terrence | -- | None Available | |
| Karch William G | -- | None Available | |
| Karch Mary Anne | $317,500 | Chicago Title | |
| Carley Thomas G | -- | -- | |
| Carley Thomas G | $261,000 | Professional Title Insurance |
Source: Public Records
Mortgage History
| Date | Status | Borrower | Loan Amount |
|---|---|---|---|
| Previous Owner | Carley Thomas G | $247,950 |
Source: Public Records
Tax History
| Year | Tax Paid | Tax Assessment Tax Assessment Total Assessment is a certain percentage of the fair market value that is determined by local assessors to be the total taxable value of land and additions on the property. | Land | Improvement |
|---|---|---|---|---|
| 2024 | $7,973 | $102,768 | $18,945 | $83,823 |
| 2023 | $7,393 | $92,207 | $16,998 | $75,209 |
| 2022 | $7,631 | $83,673 | $15,425 | $68,248 |
| 2021 | $6,778 | $77,684 | $14,321 | $63,363 |
| 2020 | $6,812 | $75,582 | $13,933 | $61,649 |
| 2019 | $7,366 | $75,582 | $13,933 | $61,649 |
| 2018 | $7,203 | $72,224 | $13,314 | $58,910 |
| 2017 | $6,050 | $67,263 | $12,400 | $54,863 |
| 2016 | $6,171 | $71,915 | $15,801 | $56,114 |
| 2014 | $5,625 | $72,328 | $15,892 | $56,436 |
| 2013 | $9,063 | $77,166 | $16,955 | $60,211 |
Source: Public Records
Map
Nearby Homes
- 616 Oak Hill Dr
- 860 Wilshire Dr
- 37 Dorchester Dr
- 120 Lynnhaven Dr
- 101 Sheffield Dr
- 7117 Gary Dr
- 8310 Old Saint Louis Rd
- 8100 Excellence Place
- 245 Oliver Lee Dr
- 121 Country Club Place
- 7000 Gary Dr
- 7522 Claymont Ct Unit 3
- 22 Country Club Place
- 7426 Foley Dr
- 7304 Northern Dr
- 25 S 76th St
- 13 Chamberlain Ct
- 10 Chamberlain Ct
- 7513 W Main St
- 38 S 86th St
- 709 Deer Run Rd
- 715 Deer Run Rd
- 801 Deer Run Rd
- 500 Oak Hill Dr
- 706 Deer Run Rd
- 504 Oak Hill Dr
- 716 Deer Run Rd
- 420 Oak Hill Dr
- 0 Deer Run Unit 17074100
- 5 Pebble Hill Dr
- 800 Turnberry Rd
- 804 Deer Run Rd
- 508 Oak Hill Dr
- 6 Pebble Hill Dr
- 808 Deer Run Rd
- 416 Oak Hill Dr
- 812 Deer Run Rd
- 301 Dorchester Dr
- 501 Oak Hill Dr
- 9 Pebble Hill Dr
Your Personal Tour Guide
Ask me questions while you tour the home.