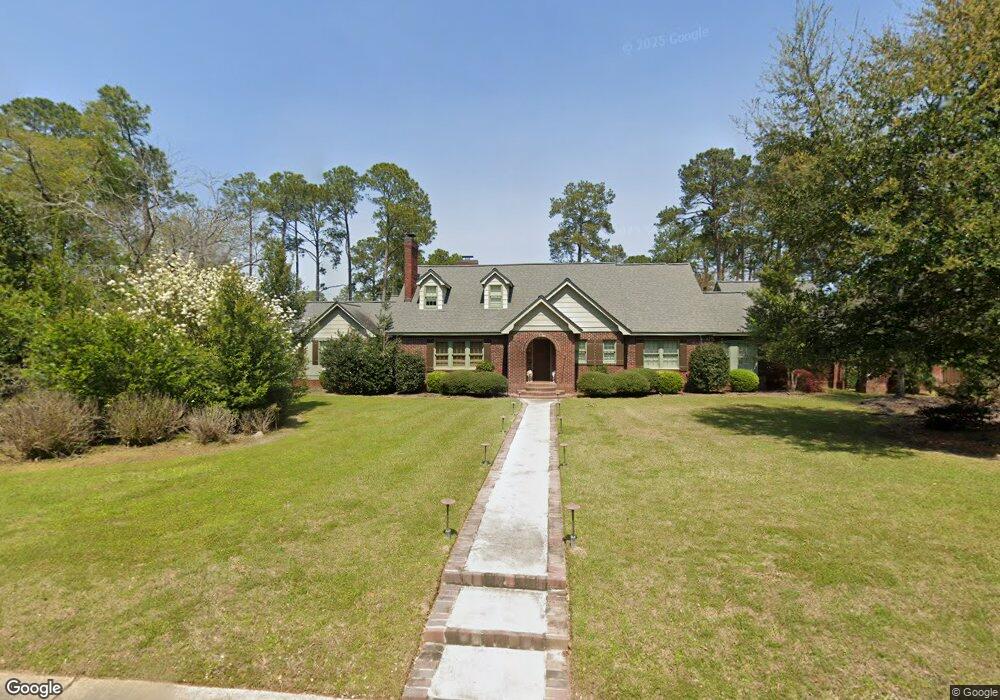
705 E 19th Ave Cordele, GA 31015
Estimated Value: $416,000 - $759,000
5
Beds
5
Baths
5,402
Sq Ft
$111/Sq Ft
Est. Value
About This Home
This home is located at 705 E 19th Ave, Cordele, GA 31015 and is currently estimated at $602,222, approximately $111 per square foot. 705 E 19th Ave is a home located in Crisp County with nearby schools including Crisp County Elementary School, Crisp County Primary School, and Crisp County Middle School.
Ownership History
Date
Name
Owned For
Owner Type
Purchase Details
Closed on
May 8, 2015
Sold by
Lyons Lynn A
Bought by
Lyons Lynn A and Lyons Kendra K
Current Estimated Value
Home Financials for this Owner
Home Financials are based on the most recent Mortgage that was taken out on this home.
Original Mortgage
$275,000
Interest Rate
3.75%
Mortgage Type
New Conventional
Purchase Details
Closed on
Mar 6, 2002
Sold by
Forehand David A
Bought by
Forehand David A and Forehand Elizabeth G
Purchase Details
Closed on
Mar 1, 2002
Sold by
Hurt Nina S
Bought by
Forehand David A
Purchase Details
Closed on
Aug 23, 2000
Sold by
Greene Palmer and Greene Eva
Bought by
Hurt Nina S
Purchase Details
Closed on
Mar 22, 1988
Sold by
Cordele Banking
Bought by
Greene Palmer and Greene Eva
Purchase Details
Closed on
Oct 4, 1983
Bought by
Cordele Banking
Create a Home Valuation Report for This Property
The Home Valuation Report is an in-depth analysis detailing your home's value as well as a comparison with similar homes in the area
Purchase History
We collect this data history from publicly available records. To have your information removed, we recommend requesting removal directly through your county’s website.
| Date | Buyer | Sale Price | Title Company |
|---|---|---|---|
| Lyons Lynn A | -- | -- | |
| Lyons Lynn A | $295,000 | -- | |
| Forehand David A | -- | -- | |
| Forehand David A | $206,000 | -- | |
| Hurt Nina S | $132,000 | -- | |
| Greene Palmer | $65,000 | -- | |
| Cordele Banking | -- | -- |
Source: Public Records
Mortgage History
We collect this data history from publicly available records. To have your information removed, we recommend requesting removal directly through your county’s website.
| Date | Status | Borrower | Loan Amount |
|---|---|---|---|
| Closed | Lyons Lynn A | $275,000 |
Source: Public Records
Tax History
| Year | Tax Paid | Tax Assessment Tax Assessment Total Assessment is a certain percentage of the fair market value that is determined by local assessors to be the total taxable value of land and additions on the property. | Land | Improvement |
|---|---|---|---|---|
| 2025 | $8,378 | $245,846 | $8,192 | $237,654 |
| 2024 | $7,917 | $222,302 | $8,192 | $214,110 |
| 2023 | $7,687 | $206,434 | $4,096 | $202,338 |
| 2022 | $5,093 | $194,662 | $4,096 | $190,566 |
| 2021 | $4,991 | $182,890 | $4,096 | $178,794 |
| 2020 | $5,135 | $184,414 | $4,000 | $180,414 |
| 2019 | $5,174 | $184,414 | $4,000 | $180,414 |
| 2018 | $5,080 | $174,332 | $7,600 | $166,732 |
| 2017 | $7,079 | $174,332 | $7,600 | $166,732 |
| 2016 | $3,489 | $174,332 | $7,600 | $166,732 |
| 2015 | -- | $174,332 | $7,600 | $166,732 |
| 2014 | -- | $174,332 | $7,600 | $166,732 |
| 2013 | -- | $174,331 | $7,600 | $166,731 |
Source: Public Records
Map
Nearby Homes
- 716 E 18th Ave
- 720 E 20th Ave
- 1002 Camellia Dr
- 709 Fleming Rd
- 610 E 15th Ave
- 1105 Camellia Dr
- 718 E 22nd Ave
- 912 Rose Ln
- 1206 Fleming Rd
- E 8th Ave
- 807 E 14th Ave
- 723 E 24th Ave
- 1207 Fleming Rd
- TBD Us Hwy 280 W Lot 33
- 31 U S 280
- TBD Us Hwy 280 W Lot #28
- TBD Us Hwy 280 W Lot#31
- TBD Us Hwy 280 W Lot #29
- TBD Us Hwy 280 W Lot 29
- TBD Us Hwy 280 W Lot# 33
- 720 E 18th Ave
- 712 E 18th Ave
- 715 E 19th Ave
- 717 E 18th Ave
- 719 E 19th Ave
- 711 E 18th Ave
- 707 E 18th Ave
- 719 E 18th Ave
- 702 E 18th Ave
- 705 E 18th Ave
- 802 E 18th Ave
- 701 E 19th Ave
- 716 E 17th Ave
- 710 S Hickory St
- 714 E 17th Ave
- 714 E 19th Ave
- 718 E 17th Ave
- 801 E 19th Ave
- 718 E 19th Ave
- 706 E 17th Ave
Your Personal Tour Guide
Ask me questions while you tour the home.