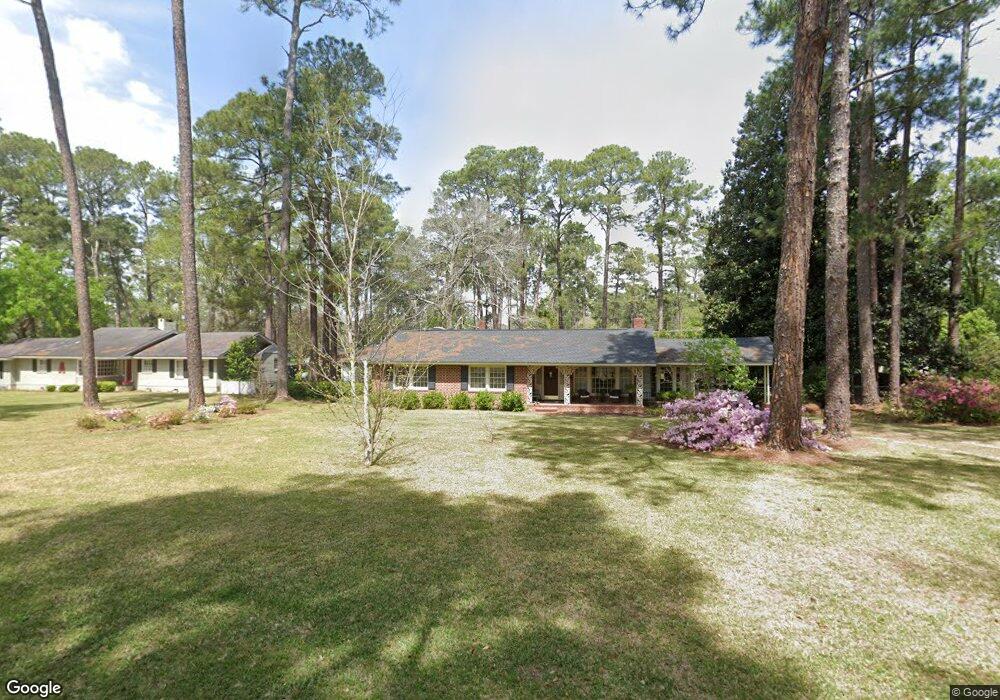
705 E 23rd Ave Cordele, GA 31015
Estimated Value: $165,736 - $212,000
3
Beds
2
Baths
2,104
Sq Ft
$89/Sq Ft
Est. Value
About This Home
This home is located at 705 E 23rd Ave, Cordele, GA 31015 and is currently estimated at $187,434, approximately $89 per square foot. 705 E 23rd Ave is a home located in Crisp County with nearby schools including Crisp County Elementary School, Crisp County Primary School, and Crisp County Middle School.
Ownership History
Date
Name
Owned For
Owner Type
Purchase Details
Closed on
Dec 2, 2015
Sold by
Cobb Jefferson F
Bought by
Caverzasi Alice Cobb
Current Estimated Value
Home Financials for this Owner
Home Financials are based on the most recent Mortgage that was taken out on this home.
Original Mortgage
$53,500
Outstanding Balance
$20,709
Interest Rate
3.16%
Mortgage Type
New Conventional
Estimated Equity
$166,725
Purchase Details
Closed on
Oct 21, 2012
Sold by
Williams Mary T
Bought by
Caverzasi Alice Cobb and Cobb Jefferson F
Purchase Details
Closed on
May 4, 1976
Bought by
Cobb Mrs Guy T
Purchase Details
Closed on
Oct 31, 1949
Bought by
Cobb Ms Guy T
Create a Home Valuation Report for This Property
The Home Valuation Report is an in-depth analysis detailing your home's value as well as a comparison with similar homes in the area
Purchase History
| Date | Buyer | Sale Price | Title Company |
|---|---|---|---|
| Caverzasi Alice Cobb | -- | -- | |
| Caverzasi Alice Cobb | -- | -- | |
| Cobb Mrs Guy T | -- | -- | |
| Cobb Ms Guy T | -- | -- |
Source: Public Records
Mortgage History
| Date | Status | Borrower | Loan Amount |
|---|---|---|---|
| Open | Caverzasi Alice Cobb | $53,500 |
Source: Public Records
Tax History
| Year | Tax Paid | Tax Assessment Tax Assessment Total Assessment is a certain percentage of the fair market value that is determined by local assessors to be the total taxable value of land and additions on the property. | Land | Improvement |
|---|---|---|---|---|
| 2025 | $1,703 | $61,265 | $6,144 | $55,121 |
| 2024 | $1,589 | $55,866 | $6,144 | $49,722 |
| 2023 | $1,440 | $50,122 | $3,072 | $47,050 |
| 2022 | $836 | $47,423 | $3,072 | $44,351 |
| 2021 | $819 | $44,723 | $3,072 | $41,651 |
| 2020 | $811 | $44,723 | $3,072 | $41,651 |
| 2019 | $1,268 | $44,723 | $3,072 | $41,651 |
| 2018 | $1,182 | $40,109 | $5,837 | $34,272 |
| 2017 | $1,629 | $40,109 | $5,837 | $34,272 |
| 2016 | $1,186 | $40,109 | $5,837 | $34,272 |
| 2015 | -- | $40,108 | $5,837 | $34,272 |
| 2014 | -- | $40,108 | $5,837 | $34,272 |
| 2013 | -- | $40,108 | $5,836 | $34,271 |
Source: Public Records
Map
Nearby Homes
Your Personal Tour Guide
Ask me questions while you tour the home.