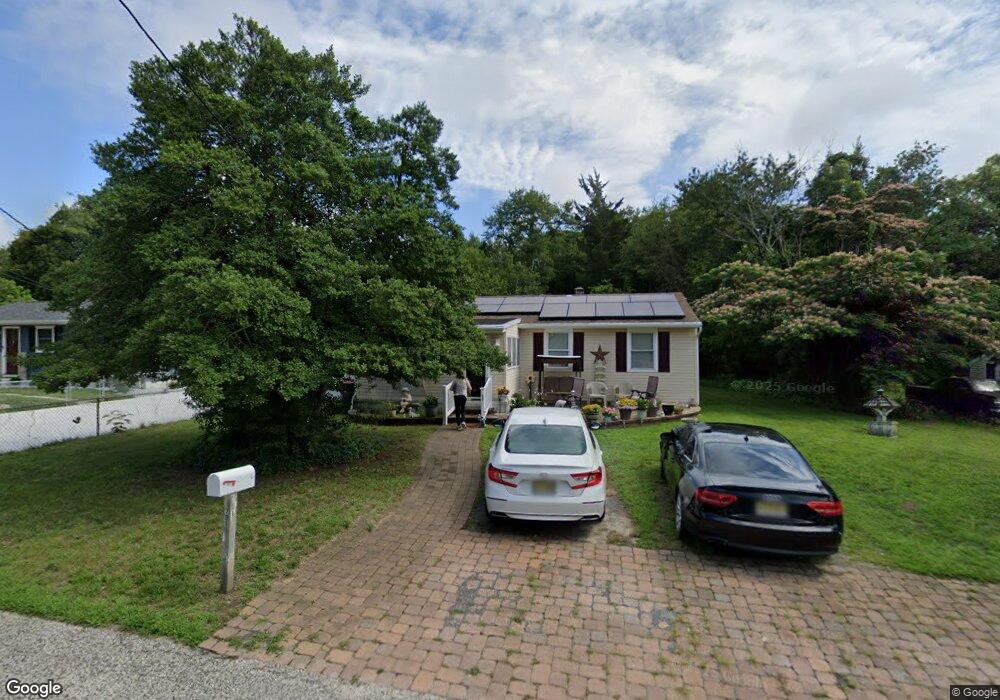
705 E Chanese Ln Galloway, NJ 08205
Estimated Value: $253,000 - $290,006
Studio
--
Bath
1,090
Sq Ft
$247/Sq Ft
Est. Value
About This Home
This home is located at 705 E Chanese Ln, Galloway, NJ 08205 and is currently estimated at $269,502, approximately $247 per square foot. 705 E Chanese Ln is a home located in Atlantic County with nearby schools including Absegami High School, Oakcrest High School, and Cedar Creek High School.
Ownership History
Date
Name
Owned For
Owner Type
Purchase Details
Closed on
May 25, 2010
Sold by
Bassford Harry and Bassford Nancy
Bought by
Bassford Nancy
Current Estimated Value
Purchase Details
Closed on
Feb 15, 2005
Sold by
Eby Rosalie
Bought by
Bassford Harry and Bassford Nancy
Home Financials for this Owner
Home Financials are based on the most recent Mortgage that was taken out on this home.
Original Mortgage
$118,500
Outstanding Balance
$54,519
Interest Rate
4.62%
Mortgage Type
New Conventional
Estimated Equity
$214,983
Purchase Details
Closed on
Aug 7, 1997
Sold by
Holgersen Glenn and Holgersen Linda A
Bought by
Eby Rosalie
Home Financials for this Owner
Home Financials are based on the most recent Mortgage that was taken out on this home.
Original Mortgage
$68,000
Interest Rate
7.42%
Purchase Details
Closed on
Nov 25, 1988
Sold by
Holgersen Linda A
Bought by
Holgersen Glenn and Holgersen Linda A
Create a Home Valuation Report for This Property
The Home Valuation Report is an in-depth analysis detailing your home's value as well as a comparison with similar homes in the area
Home Values in the Area
Average Home Value in this Area
Purchase History
| Date | Buyer | Sale Price | Title Company |
|---|---|---|---|
| Bassford Nancy | -- | None Available | |
| Bassford Harry | $158,000 | -- | |
| Eby Rosalie | $85,000 | -- | |
| Holgersen Glenn | $65,000 | -- |
Source: Public Records
Mortgage History
| Date | Status | Borrower | Loan Amount |
|---|---|---|---|
| Open | Bassford Harry | $118,500 | |
| Previous Owner | Eby Rosalie | $68,000 |
Source: Public Records
Tax History
| Year | Tax Paid | Tax Assessment Tax Assessment Total Assessment is a certain percentage of the fair market value that is determined by local assessors to be the total taxable value of land and additions on the property. | Land | Improvement |
|---|---|---|---|---|
| 2025 | $3,765 | $112,800 | $52,700 | $60,100 |
| 2024 | $3,765 | $112,800 | $52,700 | $60,100 |
Source: Public Records
Map
Nearby Homes
- 627 E Seaview Ridge Dr
- 623 E Seaview Ridge Dr
- 632 E Lost Pine Way Rd
- 703 E Great Creek Rd
- 604 E Pennsylvania Ave
- 0-0 E Dickinson Ave
- 00 Vienna Ave
- 546 A E Brook Ln
- 613 S New York Rd
- 412 E Jimmie Leeds Rd
- 126 S New York Rd
- 113 Southport Ct
- 623 E Biscayne Ave
- 528 Holly Brook Dr
- 10 E Curran Dr
- 301 S Pitney Rd
- 0 E Great Creek Rd
- 117 E Great Creek Rd
- 4 E Curran Dr
- 105 Hillside Ave
- 703 E Chanese Ln
- 707 E Chanese Ln
- 709 E Chanese Ln
- 701 E Chanese Ln
- 290 S New York Rd
- 706 E Chanese Ln
- 711 E Chanese Ln
- 700 E Chanese Ln
- 708 E Chanese Ln
- 713 E Chanese Ln
- 710 E Chanese Ln
- 306 S New York Rd
- 715 E Chanese Ln
- 712 E Chanese Ln
- 717 E Chanese Ln
- 308 S New York Rd
- 714 E Chanese Ln
- 719 E Chanese Ln
- 634 Park Place
- 716 E Chanese Ln
Your Personal Tour Guide
Ask me questions while you tour the home.