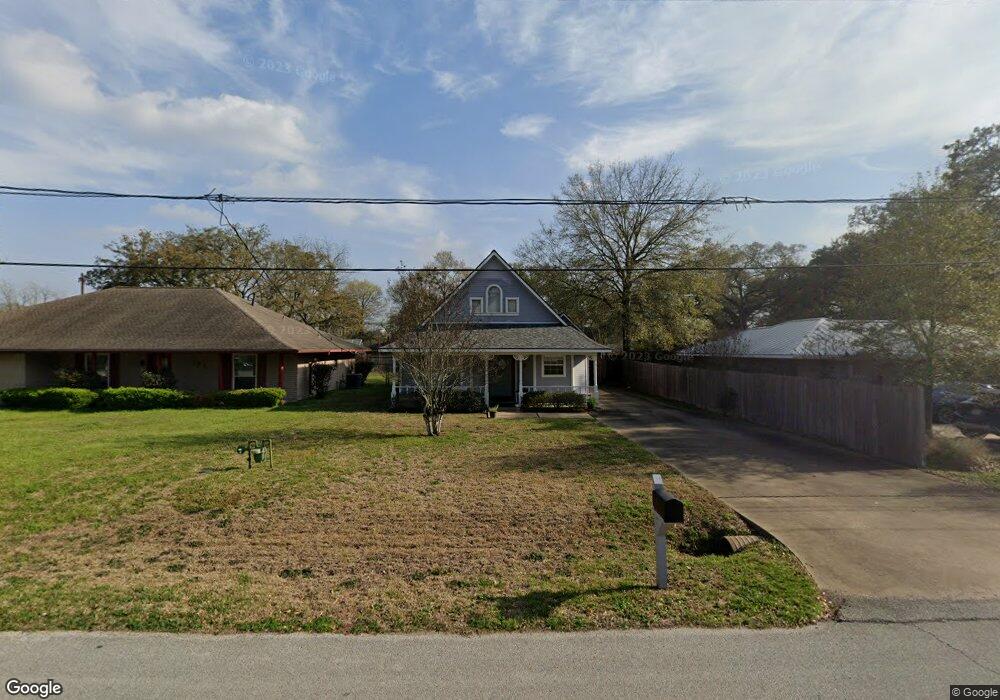
705 Hicks St Tomball, TX 77375
Estimated Value: $284,337 - $326,000
2
Beds
2
Baths
1,204
Sq Ft
$251/Sq Ft
Est. Value
About This Home
This home is located at 705 Hicks St, Tomball, TX 77375 and is currently estimated at $302,334, approximately $251 per square foot. 705 Hicks St is a home located in Harris County with nearby schools including Tomball Elementary School, Tomball Intermediate School, and Tomball Junior High School.
Ownership History
Date
Name
Owned For
Owner Type
Purchase Details
Closed on
Dec 14, 2016
Sold by
Norem Jeffrey
Bought by
Norem Jeffrey
Current Estimated Value
Purchase Details
Closed on
Apr 26, 2007
Sold by
Negrete Laverne
Bought by
Norem Thelma L
Home Financials for this Owner
Home Financials are based on the most recent Mortgage that was taken out on this home.
Original Mortgage
$62,500
Outstanding Balance
$37,748
Interest Rate
6.13%
Mortgage Type
Purchase Money Mortgage
Estimated Equity
$264,586
Purchase Details
Closed on
Oct 21, 1998
Sold by
Molinar Rafael and Molinar Graciela
Bought by
Ayala Juan R and Ayala Jovita B
Home Financials for this Owner
Home Financials are based on the most recent Mortgage that was taken out on this home.
Original Mortgage
$52,200
Interest Rate
6.73%
Create a Home Valuation Report for This Property
The Home Valuation Report is an in-depth analysis detailing your home's value as well as a comparison with similar homes in the area
Home Values in the Area
Average Home Value in this Area
Purchase History
| Date | Buyer | Sale Price | Title Company |
|---|---|---|---|
| Norem Jeffrey | -- | None Available | |
| Norem Thelma L | -- | Stewart Title Houston Div | |
| Ayala Juan R | -- | Texas American Title Company |
Source: Public Records
Mortgage History
| Date | Status | Borrower | Loan Amount |
|---|---|---|---|
| Open | Norem Thelma L | $62,500 | |
| Previous Owner | Ayala Juan R | $52,200 |
Source: Public Records
Tax History Compared to Growth
Tax History
| Year | Tax Paid | Tax Assessment Tax Assessment Total Assessment is a certain percentage of the fair market value that is determined by local assessors to be the total taxable value of land and additions on the property. | Land | Improvement |
|---|---|---|---|---|
| 2025 | $1,239 | $295,308 | $105,000 | $190,308 |
| 2024 | $1,239 | $291,460 | $98,000 | $193,460 |
| 2023 | $1,239 | $280,721 | $84,000 | $196,721 |
| 2022 | $4,487 | $234,279 | $63,000 | $171,279 |
| 2021 | $4,292 | $180,954 | $45,500 | $135,454 |
| 2020 | $4,194 | $180,954 | $35,000 | $145,954 |
| 2019 | $3,922 | $155,454 | $28,000 | $127,454 |
| 2018 | $1,926 | $168,740 | $28,000 | $140,740 |
| 2017 | $3,703 | $170,216 | $28,000 | $142,216 |
| 2016 | $3,366 | $159,903 | $28,000 | $131,903 |
| 2015 | $1,025 | $158,659 | $28,000 | $130,659 |
| 2014 | $1,025 | $110,407 | $28,000 | $82,407 |
Source: Public Records
Map
Nearby Homes
- 204 Vernon St
- 200 S Vernon St
- 20734 Open Range Ct
- 18818 Cornelia Fields Ln
- 18723 Buttercup Farms Ln
- 20718 Open Range Ct
- 19951 Epona Creek Dr
- 19935 Epona Creek Dr
- 18707 Buttercup Farms Ln
- 20710 Open Range Ct
- 18826 Cornelia Fields Ln
- 20714 Open Range Ct
- 504 Percival St Unit A
- 505 Percival St
- 516 Clayton St
- TBD Clayton St
- 16623 Farm To Market 2920
- 0 Fm-2920
- 0 N Sycamore St
- 1126 Audrey Trail