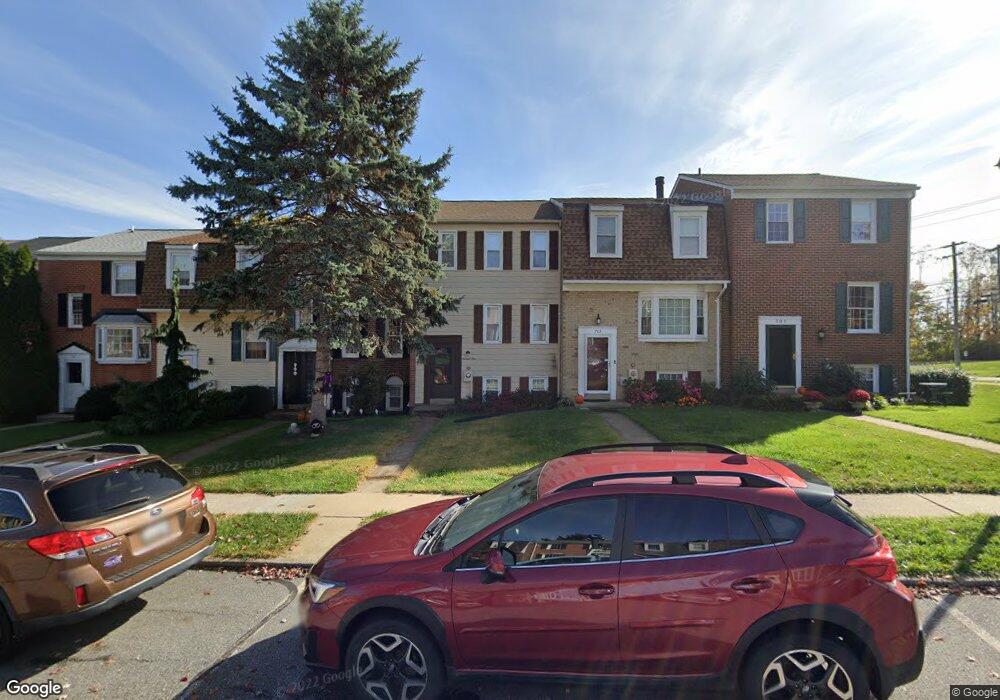
705 Horpel Dr Mount Airy, MD 21771
Estimated Value: $291,229 - $358,000
--
Bed
3
Baths
1,188
Sq Ft
$286/Sq Ft
Est. Value
About This Home
This home is located at 705 Horpel Dr, Mount Airy, MD 21771 and is currently estimated at $339,807, approximately $286 per square foot. 705 Horpel Dr is a home located in Carroll County with nearby schools including Parr's Ridge Elementary School, Mount Airy Elementary School, and Mount Airy Middle School.
Ownership History
Date
Name
Owned For
Owner Type
Purchase Details
Closed on
Nov 14, 2008
Sold by
Self Michael K
Bought by
Self Michael K
Current Estimated Value
Home Financials for this Owner
Home Financials are based on the most recent Mortgage that was taken out on this home.
Original Mortgage
$150,000
Interest Rate
6.13%
Mortgage Type
Stand Alone Refi Refinance Of Original Loan
Purchase Details
Closed on
Oct 31, 2008
Sold by
Self Michael K
Bought by
Self Michael K
Home Financials for this Owner
Home Financials are based on the most recent Mortgage that was taken out on this home.
Original Mortgage
$150,000
Interest Rate
6.13%
Mortgage Type
Stand Alone Refi Refinance Of Original Loan
Purchase Details
Closed on
Oct 1, 1990
Sold by
Standifer Norman Terry
Bought by
Self Michael K
Purchase Details
Closed on
Sep 11, 1986
Sold by
Smith Stephen D
Bought by
Standifer Norman Terry
Home Financials for this Owner
Home Financials are based on the most recent Mortgage that was taken out on this home.
Original Mortgage
$70,584
Interest Rate
9.9%
Create a Home Valuation Report for This Property
The Home Valuation Report is an in-depth analysis detailing your home's value as well as a comparison with similar homes in the area
Home Values in the Area
Average Home Value in this Area
Purchase History
| Date | Buyer | Sale Price | Title Company |
|---|---|---|---|
| Self Michael K | -- | -- | |
| Self Michael K | -- | -- | |
| Self Michael K | $105,000 | -- | |
| Standifer Norman Terry | $70,500 | -- |
Source: Public Records
Mortgage History
| Date | Status | Borrower | Loan Amount |
|---|---|---|---|
| Closed | Self Michael K | $150,000 | |
| Closed | Self Michael K | $150,000 | |
| Previous Owner | Standifer Norman Terry | $70,584 |
Source: Public Records
Tax History Compared to Growth
Tax History
| Year | Tax Paid | Tax Assessment Tax Assessment Total Assessment is a certain percentage of the fair market value that is determined by local assessors to be the total taxable value of land and additions on the property. | Land | Improvement |
|---|---|---|---|---|
| 2025 | $2,712 | $242,733 | $0 | $0 |
| 2024 | $2,712 | $225,300 | $90,000 | $135,300 |
| 2023 | $2,627 | $220,733 | $0 | $0 |
| 2022 | $2,443 | $216,167 | $0 | $0 |
| 2021 | $5,081 | $211,600 | $69,000 | $142,600 |
| 2020 | $5,005 | $210,367 | $0 | $0 |
| 2019 | $2,477 | $209,133 | $0 | $0 |
| 2018 | $2,469 | $207,900 | $68,000 | $139,900 |
| 2017 | $2,335 | $201,533 | $0 | $0 |
| 2016 | -- | $195,167 | $0 | $0 |
| 2015 | -- | $188,800 | $0 | $0 |
| 2014 | -- | $188,800 | $0 | $0 |
Source: Public Records
Map
Nearby Homes
- 714 Robinwood Dr
- 33 N Towne Ct
- 1008 N Main St
- .58+- ACRES Center St
- 211 Carroll Ave
- 1506 Summer Sweet Ln
- 0 Watersville Rd Unit MDCR2019316
- 208 East Rd
- 3698 W Watersville Rd
- 202 Troon Cir
- 807 Kingsbridge Terrace
- 1702 Fieldbrook Ln
- 1308 Crossbow Rd
- 902 Parade Ln
- 1718 Trestle St
- 704 Meadow Field Ct
- 1010 Parade Ln
- 6633 Wind Ridge Rd
- 1402 Woodenbridge Ln
- 1410 Woodenbridge Ln