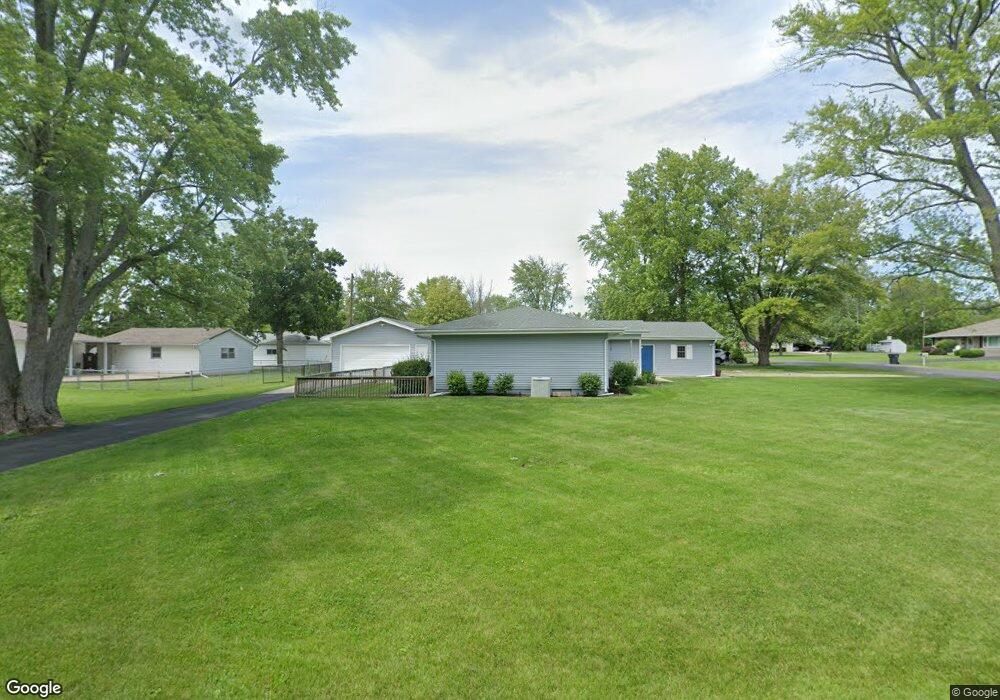
705 Kirk Dr Mount Zion, IL 62549
Estimated Value: $180,749 - $197,000
--
Bed
--
Bath
1,664
Sq Ft
$114/Sq Ft
Est. Value
About This Home
This home is located at 705 Kirk Dr, Mount Zion, IL 62549 and is currently estimated at $189,437, approximately $113 per square foot. 705 Kirk Dr is a home located in Macon County with nearby schools including McGaughey Elementary School, Mt. Zion Intermediate School, and Mt. Zion Elementary School.
Ownership History
Date
Name
Owned For
Owner Type
Purchase Details
Closed on
Dec 19, 2022
Sold by
Sloan William D
Bought by
Sloan William D and Sloan Brandon
Current Estimated Value
Purchase Details
Closed on
Jul 10, 2017
Sold by
Yearta Zachary
Bought by
Yearta Douglas and Yearta Chris
Home Financials for this Owner
Home Financials are based on the most recent Mortgage that was taken out on this home.
Original Mortgage
$100,201
Interest Rate
4%
Mortgage Type
VA
Purchase Details
Closed on
Sep 28, 2012
Sold by
Weedman Charlene L and Benton Robert E
Bought by
Yearta Zachary S
Home Financials for this Owner
Home Financials are based on the most recent Mortgage that was taken out on this home.
Original Mortgage
$76,000
Interest Rate
3.5%
Mortgage Type
New Conventional
Purchase Details
Closed on
Sep 1, 2012
Home Financials for this Owner
Home Financials are based on the most recent Mortgage that was taken out on this home.
Original Mortgage
$76,000
Interest Rate
3.5%
Mortgage Type
New Conventional
Create a Home Valuation Report for This Property
The Home Valuation Report is an in-depth analysis detailing your home's value as well as a comparison with similar homes in the area
Home Values in the Area
Average Home Value in this Area
Purchase History
| Date | Buyer | Sale Price | Title Company |
|---|---|---|---|
| Sloan William D | -- | None Listed On Document | |
| Sloan William D | $155,000 | -- | |
| Yearta Douglas | -- | None Available | |
| Yearta Zachary S | $40,000 | None Available | |
| -- | $80,000 | -- |
Source: Public Records
Mortgage History
| Date | Status | Borrower | Loan Amount |
|---|---|---|---|
| Previous Owner | Yearta Douglas | $100,201 | |
| Previous Owner | Yearta Zachary S | $76,000 |
Source: Public Records
Tax History Compared to Growth
Tax History
| Year | Tax Paid | Tax Assessment Tax Assessment Total Assessment is a certain percentage of the fair market value that is determined by local assessors to be the total taxable value of land and additions on the property. | Land | Improvement |
|---|---|---|---|---|
| 2024 | $3,085 | $50,519 | $6,050 | $44,469 |
| 2023 | $2,652 | $46,986 | $5,627 | $41,359 |
| 2022 | $2,906 | $44,567 | $5,338 | $39,229 |
| 2021 | $2,815 | $41,751 | $5,000 | $36,751 |
| 2020 | $3,066 | $41,953 | $5,480 | $36,473 |
| 2019 | $3,577 | $41,953 | $5,480 | $36,473 |
| 2018 | $3,477 | $40,882 | $5,340 | $35,542 |
| 2017 | $2,923 | $40,096 | $5,237 | $34,859 |
| 2016 | $2,890 | $39,399 | $5,146 | $34,253 |
| 2015 | $2,793 | $39,009 | $5,095 | $33,914 |
| 2014 | $2,693 | $39,009 | $5,095 | $33,914 |
| 2013 | $3,219 | $39,009 | $5,095 | $33,914 |
Source: Public Records
Map
Nearby Homes
- 125 W Walnut St
- 524 Elm St
- 1440 N Alexander Dr
- 355 S Henderson St
- 1420 Noble Dr
- 5909 Camp Warren Rd
- 1625 Ridgewood Ct
- 3930 S Mount Zion Rd
- 265 Carrington Ave
- 1700 Brentwood Dr
- 6680 John Dr
- 6686 John Dr
- 860 W Wildwood Dr
- 695 Country Ct
- Lot 32 Janine Way
- Lot 3 Fletcher Ln
- Lot 1 Fletcher Ln
- Lot 2 Fletcher Ln
- 1610 Robin Ct
- 1030 Country Manor