Estimated Value: $642,000 - $699,000
3
Beds
4
Baths
3,099
Sq Ft
$217/Sq Ft
Est. Value
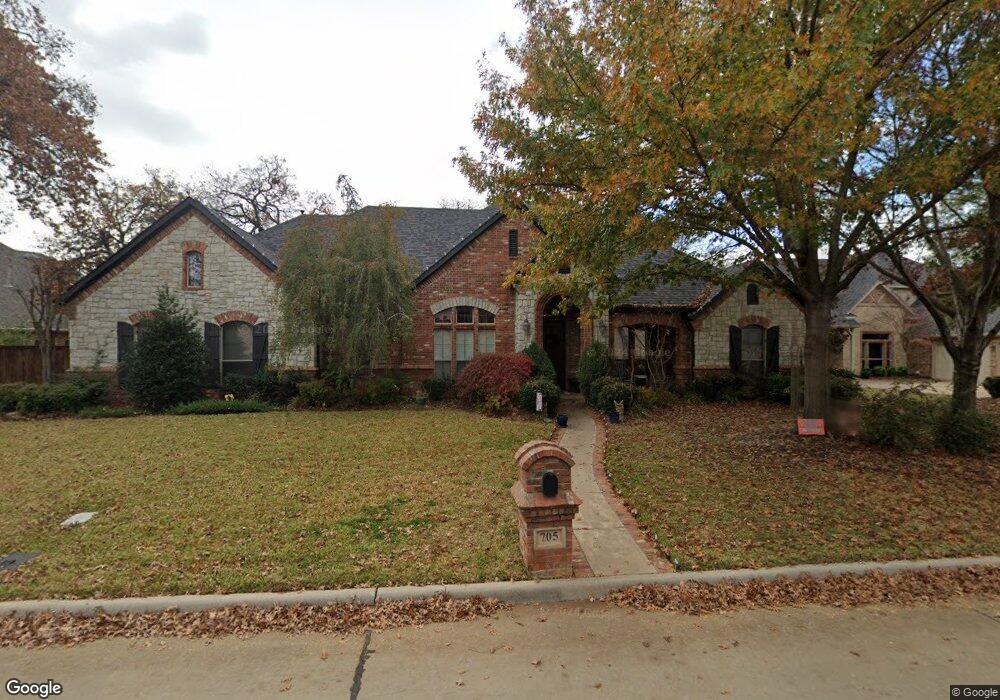
About This Home
This home is located at 705 Lonesome Dove Trail, Hurst, TX 76054 and is currently estimated at $673,040, approximately $217 per square foot. 705 Lonesome Dove Trail is a home located in Tarrant County with nearby schools including W.A. Porter Elementary School, Smithfield Middle School, and Birdville High School.
Ownership History
Date
Name
Owned For
Owner Type
Purchase Details
Closed on
Aug 9, 2019
Sold by
Hall Bertha and Hall Frank
Bought by
Redmon Sally
Current Estimated Value
Purchase Details
Closed on
Jul 15, 2008
Sold by
Sinquefield Ronnie and Sinquefield Karen
Bought by
Hall Bertha and Hall Frank
Home Financials for this Owner
Home Financials are based on the most recent Mortgage that was taken out on this home.
Original Mortgage
$308,750
Interest Rate
6.36%
Mortgage Type
Purchase Money Mortgage
Purchase Details
Closed on
Jul 11, 2003
Sold by
Westin Custom Home Builders Llc
Bought by
Sinquefield Ronnie and Sinquefield Karen
Home Financials for this Owner
Home Financials are based on the most recent Mortgage that was taken out on this home.
Original Mortgage
$224,000
Interest Rate
5.19%
Mortgage Type
Purchase Money Mortgage
Create a Home Valuation Report for This Property
The Home Valuation Report is an in-depth analysis detailing your home's value as well as a comparison with similar homes in the area
Home Values in the Area
Average Home Value in this Area
Purchase History
| Date | Buyer | Sale Price | Title Company |
|---|---|---|---|
| Redmon Sally | -- | None Available | |
| Hall Bertha | -- | None Available | |
| Sinquefield Ronnie | -- | Commonwealth Land Title |
Source: Public Records
Mortgage History
| Date | Status | Borrower | Loan Amount |
|---|---|---|---|
| Previous Owner | Hall Bertha | $308,750 | |
| Previous Owner | Sinquefield Ronnie | $224,000 |
Source: Public Records
Tax History Compared to Growth
Tax History
| Year | Tax Paid | Tax Assessment Tax Assessment Total Assessment is a certain percentage of the fair market value that is determined by local assessors to be the total taxable value of land and additions on the property. | Land | Improvement |
|---|---|---|---|---|
| 2025 | $15,098 | $683,740 | $101,362 | $582,378 |
| 2024 | $15,098 | $683,740 | $101,362 | $582,378 |
| 2023 | $12,657 | $553,800 | $101,362 | $452,438 |
| 2022 | $11,894 | $481,079 | $101,362 | $379,717 |
| 2021 | $12,025 | $463,548 | $70,000 | $393,548 |
| 2020 | $10,599 | $412,441 | $70,000 | $342,441 |
| 2019 | $11,789 | $476,331 | $70,000 | $406,331 |
| 2018 | $6,931 | $407,760 | $70,000 | $337,760 |
| 2017 | $9,892 | $370,691 | $70,000 | $300,691 |
| 2016 | $9,084 | $340,421 | $50,000 | $290,421 |
| 2015 | $6,878 | $329,548 | $50,000 | $279,548 |
| 2014 | $6,878 | $308,600 | $45,000 | $263,600 |
Source: Public Records
Map
Nearby Homes
- 3309 Texas Trail Ct
- 716 Bridget Way
- 712 Bear Creek Dr
- 716 Bear Creek Dr
- 713 Corsair Ct
- 621 Trails End Ct
- 3412 Glade Creek Dr
- 3512 Osprey Dr
- Bolsins Plan at Adkins Park
- Bellhaven Plan at Adkins Park
- 3404 Osprey Dr
- Grady Plan at Adkins Park
- 701 Corsair Ct
- Hillman Plan at Adkins Park
- Kenney Plan at Adkins Park
- Neece Plan at Adkins Park
- Bonham Plan at Adkins Park
- Todd Plan at Adkins Park
- 616A Plan at Adkins Park - 70'
- 655A Plan at Adkins Park - 70'
- 709 Lonesome Dove Trail
- 3417 Texas Trail
- 3413 Texas Trail
- 708 Lonesome Dove Trail
- 3421 Texas Trail
- 3409 Texas Trail
- 712 Lonesome Dove Trail
- 704 Lonesome Dove Trail
- 3412 Comanche Trail
- 3408 Comanche Trail
- 716 Lonesome Dove Trail
- 3405 Texas Trail
- 3404 Comanche Trail
- 3416 Texas Trail
- 3420 Texas Trail
- 3412 Texas Trail
- 720 Lonesome Dove Trail
- 3400 Comanche Trail
- 3505 Texas Trail
- 3424 Texas Trail