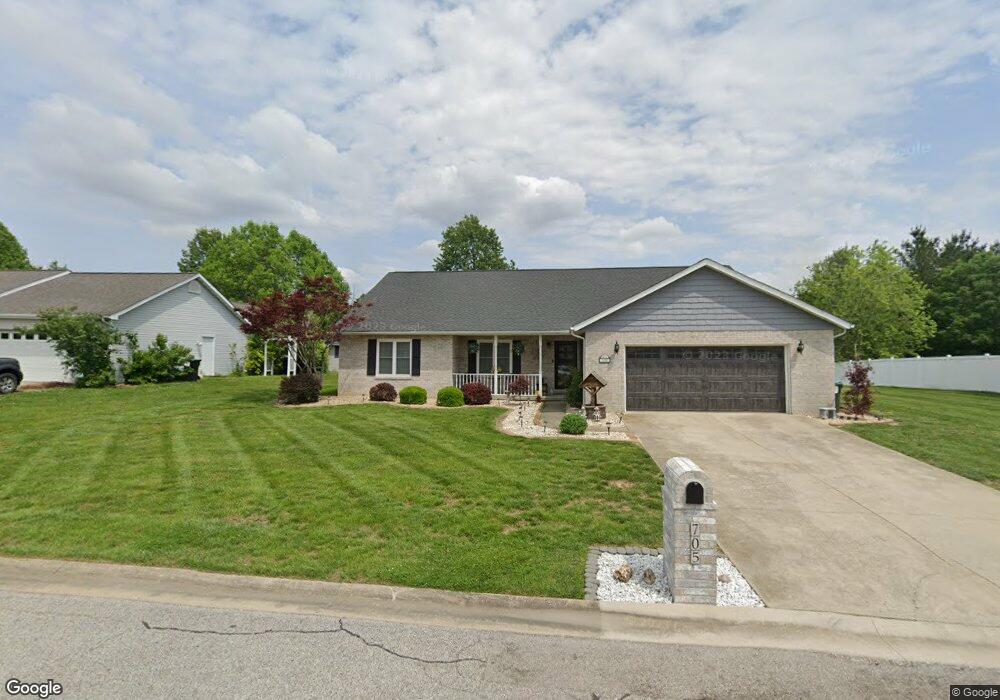
705 Mary Ann Ct Freeburg, IL 62243
Estimated Value: $189,000 - $252,000
3
Beds
2
Baths
2,088
Sq Ft
$110/Sq Ft
Est. Value
About This Home
This home is located at 705 Mary Ann Ct, Freeburg, IL 62243 and is currently estimated at $229,170, approximately $109 per square foot. 705 Mary Ann Ct is a home located in St. Clair County with nearby schools including Freeburg Elementary School, Freeburg Community High School, and St. Joseph Catholic School.
Ownership History
Date
Name
Owned For
Owner Type
Purchase Details
Closed on
Jul 16, 2021
Sold by
Estes Renee
Bought by
Estes Renee and Estes Betty J
Current Estimated Value
Purchase Details
Closed on
Feb 2, 2018
Sold by
Beckett Shawn and Beckett Keli
Bought by
Estes Renee
Home Financials for this Owner
Home Financials are based on the most recent Mortgage that was taken out on this home.
Original Mortgage
$84,800
Outstanding Balance
$60,160
Interest Rate
3.94%
Mortgage Type
New Conventional
Estimated Equity
$169,010
Purchase Details
Closed on
Apr 25, 2011
Sold by
Menard Lauren and Menard Bradley Michael
Bought by
Beckett Shawn and Beckett Keli
Purchase Details
Closed on
Jul 14, 2006
Sold by
Locke Ronald L and Locke Linda S
Bought by
Menard Lauren
Home Financials for this Owner
Home Financials are based on the most recent Mortgage that was taken out on this home.
Original Mortgage
$135,000
Interest Rate
6.72%
Mortgage Type
Purchase Money Mortgage
Create a Home Valuation Report for This Property
The Home Valuation Report is an in-depth analysis detailing your home's value as well as a comparison with similar homes in the area
Home Values in the Area
Average Home Value in this Area
Purchase History
| Date | Buyer | Sale Price | Title Company |
|---|---|---|---|
| Estes Renee | -- | Illinois Title & Escrow | |
| Estes Renee | $106,000 | Lllinois Title & Escrow | |
| Beckett Shawn | $152,500 | Community Title Shiloh Llc | |
| Menard Lauren | $145,000 | Metro East Title Corporation |
Source: Public Records
Mortgage History
| Date | Status | Borrower | Loan Amount |
|---|---|---|---|
| Open | Estes Renee | $84,800 | |
| Previous Owner | Menard Lauren | $135,000 |
Source: Public Records
Tax History Compared to Growth
Tax History
| Year | Tax Paid | Tax Assessment Tax Assessment Total Assessment is a certain percentage of the fair market value that is determined by local assessors to be the total taxable value of land and additions on the property. | Land | Improvement |
|---|---|---|---|---|
| 2024 | $3,229 | $49,624 | $10,991 | $38,633 |
| 2023 | $3,129 | $47,895 | $10,608 | $37,287 |
| 2022 | $2,936 | $44,879 | $9,940 | $34,939 |
| 2021 | $2,787 | $42,251 | $9,358 | $32,893 |
| 2020 | $2,617 | $38,437 | $8,513 | $29,924 |
| 2019 | $2,762 | $36,766 | $8,799 | $27,967 |
| 2018 | $2,710 | $36,280 | $8,683 | $27,597 |
| 2017 | $4,973 | $61,506 | $11,859 | $49,647 |
| 2016 | $4,909 | $58,948 | $11,366 | $47,582 |
| 2014 | $3,872 | $53,280 | $11,663 | $41,617 |
| 2013 | $3,227 | $52,805 | $11,559 | $41,246 |
Source: Public Records
Map
Nearby Homes
- 3 Park St
- 0 Hickory Dr
- 103 Draco Dr
- 109 Willow Dr
- 111 Willow Dr
- 106 S Vine St
- 207 N Edison St
- 401 N Edison St
- 312 W Phillips St
- 206 N Main St
- 520 N Edison St
- 302 N Railroad St
- tbb Illinois 15
- 420 Foxtail Dr
- 440 Foxtail Dr
- 433 Foxtail Dr
- 304 Torrington Ln
- 359 Sleeping Indian Dr
- 363 Sleeping Indian Dr
- 222 Alamosa Dr
- 703 Mary Ann Ct
- 707 Mary Ann Ct
- 704 Mary Ann Ct
- 702 Mary Ann Ct
- 701 Mary Ann Ct
- 706 Mary Ann Ct
- 709 Mary Ann Ct
- 708 Saxony Ln
- 700 Mary Ann Ct
- 708 Mary Ann Ct
- 711 Mary Ann Ct
- 705 N Kristie Lynn St
- 703 N Kristie Lynn St
- 707 N Kristie Lynn St
- 701 N Kristie Lynn St
- 709 N Kristie Lynn St
- 808 Saxony Ln
- 11 Woodview Dr
- 713 Mary Ann Ct
- 712 Mary Ann Ct