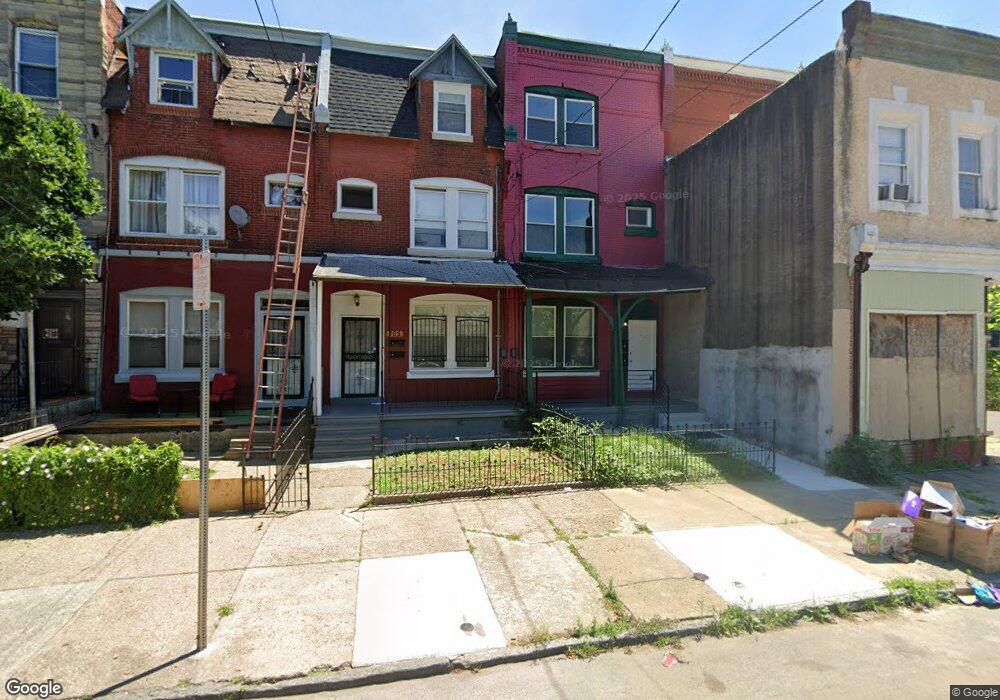
705 N 43rd St Unit 2ND FL Philadelphia, PA 19104
Haverford North NeighborhoodEstimated Value: $451,000
3
Beds
1
Bath
1,728
Sq Ft
$261/Sq Ft
Est. Value
About This Home
This home is located at 705 N 43rd St Unit 2ND FL, Philadelphia, PA 19104 and is currently estimated at $451,000, approximately $260 per square foot. 705 N 43rd St Unit 2ND FL is a home located in Philadelphia County with nearby schools including Martha Washington Academics Plus School, West Philadelphia High School, and Our Mother of Sorrows/St. Ignatius of Loyola Catholic School.
Ownership History
Date
Name
Owned For
Owner Type
Purchase Details
Closed on
Nov 9, 2017
Sold by
Is Jamming Lklc
Bought by
Mandefro Ms Israel
Current Estimated Value
Home Financials for this Owner
Home Financials are based on the most recent Mortgage that was taken out on this home.
Original Mortgage
$135,327
Outstanding Balance
$112,823
Interest Rate
3.75%
Mortgage Type
FHA
Estimated Equity
$338,177
Purchase Details
Closed on
Nov 10, 2011
Sold by
L & H Properties Llc
Bought by
Bynum Demond and The Estate Of Kamryn Gilliam
Purchase Details
Closed on
Jan 17, 2008
Sold by
East Rock Financial Llc
Bought by
L & H Properties Llc
Purchase Details
Closed on
Aug 8, 2007
Sold by
Equicredit Corp Of America
Bought by
East Rock Financial Llc
Purchase Details
Closed on
Jan 9, 2007
Sold by
Mcnair Dewey and Patterson Mason
Bought by
Equicredit Corp Of America
Purchase Details
Closed on
Oct 27, 1995
Sold by
Wilson Catherine W
Bought by
Mcnair Dewey and Patterson Mason
Purchase Details
Closed on
Jan 2, 1995
Sold by
Green John D
Bought by
Wilson Catherine W
Create a Home Valuation Report for This Property
The Home Valuation Report is an in-depth analysis detailing your home's value as well as a comparison with similar homes in the area
Home Values in the Area
Average Home Value in this Area
Purchase History
| Date | Buyer | Sale Price | Title Company |
|---|---|---|---|
| Mandefro Ms Israel | $140,000 | Assurance Abstract Corp | |
| Bynum Demond | $77,500 | None Available | |
| L & H Properties Llc | $30,000 | None Available | |
| East Rock Financial Llc | $15,832 | None Available | |
| Equicredit Corp Of America | $55,000 | None Available | |
| Mcnair Dewey | $6,700 | -- | |
| Wilson Catherine W | $9,000 | -- |
Source: Public Records
Mortgage History
| Date | Status | Borrower | Loan Amount |
|---|---|---|---|
| Open | Mandefro Ms Israel | $135,327 |
Source: Public Records
Tax History Compared to Growth
Tax History
| Year | Tax Paid | Tax Assessment Tax Assessment Total Assessment is a certain percentage of the fair market value that is determined by local assessors to be the total taxable value of land and additions on the property. | Land | Improvement |
|---|---|---|---|---|
| 2026 | $4,755 | $285,000 | $57,000 | $228,000 |
| 2025 | $4,755 | $430,000 | $86,000 | $344,000 |
| 2024 | $4,755 | $430,000 | $86,000 | $344,000 |
| 2023 | $4,755 | $339,700 | $67,940 | $271,760 |
| 2022 | $753 | $339,700 | $67,940 | $271,760 |
| 2021 | $753 | $0 | $0 | $0 |
| 2020 | $753 | $0 | $0 | $0 |
| 2019 | $725 | $0 | $0 | $0 |
| 2018 | $1,625 | $0 | $0 | $0 |
| 2017 | $1,625 | $0 | $0 | $0 |
| 2016 | $1,625 | $0 | $0 | $0 |
| 2015 | $11,598 | $0 | $0 | $0 |
| 2014 | -- | $118,700 | $7,766 | $110,934 |
| 2012 | -- | $4,512 | $1,059 | $3,453 |
Source: Public Records
Map
Nearby Homes
- 638 Hutton St
- 627 Hutton St
- 619 Hutton St
- 636 Hutton St
- 629 N Hutton St
- 617 N Hutton St
- 710 N 42nd St
- 4234 Aspen St
- 4220 Wallace St
- 4207 Aspen St
- 4310 Wallace St
- 4130 42 Aspen St
- 661 Brooklyn St
- 644 Brooklyn St
- 770 Brooklyn St
- 606 N 43rd St
- 4231 Haverford Ave
- 4303 Haverford Ave
- 4207 Lancaster Ave
- 735 N 42nd St
- 705 N 43rd St
- 707 N 43rd St
- 703 N 43rd St
- 703 N 43rd St Unit 1
- 703 N 43rd St Unit 2
- 709 N 43rd St
- 701 N 43rd St
- 711 N 43rd St
- 4247 Fairmount Ave
- 713 N 43rd St
- 4245 Fairmount Ave
- 715 N 43rd St
- 946 N 43rd St
- 918 N 43rd St
- 839 N 43rd St
- 801 N 43rd St
- 829 N 43rd St
- 803 N 43rd St
- 717 N 43rd St
- 4243 Fairmount Ave