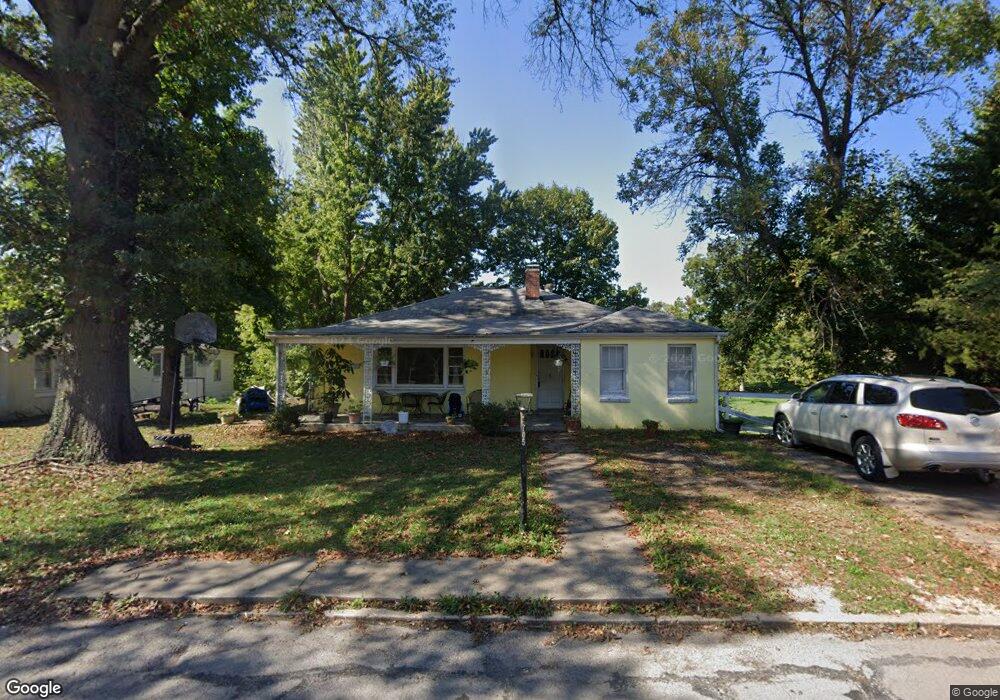
705 N 5th St Elsberry, MO 63343
Estimated Value: $151,762 - $179,000
2
Beds
1
Bath
1,328
Sq Ft
$125/Sq Ft
Est. Value
About This Home
This home is located at 705 N 5th St, Elsberry, MO 63343 and is currently estimated at $165,441, approximately $124 per square foot. 705 N 5th St is a home located in Lincoln County with nearby schools including Clarence Cannon Elementary School, Ida Cannon Middle School, and Elsberry High School.
Ownership History
Date
Name
Owned For
Owner Type
Purchase Details
Closed on
Mar 11, 2013
Sold by
Secretary Of Hud
Bought by
Aguilera Fernando and Aguilera Jamie M
Current Estimated Value
Home Financials for this Owner
Home Financials are based on the most recent Mortgage that was taken out on this home.
Original Mortgage
$21,440
Interest Rate
3.57%
Mortgage Type
FHA
Purchase Details
Closed on
Feb 16, 2012
Sold by
Cobb Lyndsie N
Bought by
Goverment National Mortgage Assn
Create a Home Valuation Report for This Property
The Home Valuation Report is an in-depth analysis detailing your home's value as well as a comparison with similar homes in the area
Purchase History
| Date | Buyer | Sale Price | Title Company |
|---|---|---|---|
| Aguilera Fernando | -- | None Available | |
| Goverment National Mortgage Assn | $75,425 | None Available |
Source: Public Records
Mortgage History
| Date | Status | Borrower | Loan Amount |
|---|---|---|---|
| Closed | Aguilera Fernando | $21,440 |
Source: Public Records
Tax History
| Year | Tax Paid | Tax Assessment Tax Assessment Total Assessment is a certain percentage of the fair market value that is determined by local assessors to be the total taxable value of land and additions on the property. | Land | Improvement |
|---|---|---|---|---|
| 2025 | $825 | $13,435 | $927 | $12,508 |
| 2024 | $770 | $12,440 | $580 | $11,860 |
| 2023 | $767 | $12,439 | $580 | $11,860 |
| 2022 | $721 | $11,737 | $580 | $11,157 |
| 2021 | $725 | $61,770 | $0 | $0 |
| 2020 | $627 | $54,080 | $0 | $0 |
| 2019 | $627 | $54,080 | $0 | $0 |
| 2018 | $652 | $10,553 | $0 | $0 |
| 2017 | $653 | $10,553 | $0 | $0 |
| 2016 | $629 | $9,920 | $0 | $0 |
| 2015 | $629 | $9,920 | $0 | $0 |
| 2014 | $641 | $10,051 | $0 | $0 |
| 2013 | -- | $10,051 | $0 | $0 |
Source: Public Records
Map
Nearby Homes
- 717 N 5th St
- 515 Bailey Ave
- 512 N 3rd St
- 201 N 3rd St
- 410 N 5th St
- 210 N 4th St
- 205 N 3rd St
- 202 N 3rd St
- 107 N Main St
- 109 S 6th St
- 110 N Sanderson Ave
- 302 S 3rd St
- 960 State Highway B
- 2662 Missouri 79
- 00 Evans Ln
- 0 Norton Woods Rd Unit 1094523
- 0 Norton Woods Rd Unit 17073496
- 1677 Highway B
- 1677 State Highway B
- 32 Dr
Your Personal Tour Guide
Ask me questions while you tour the home.