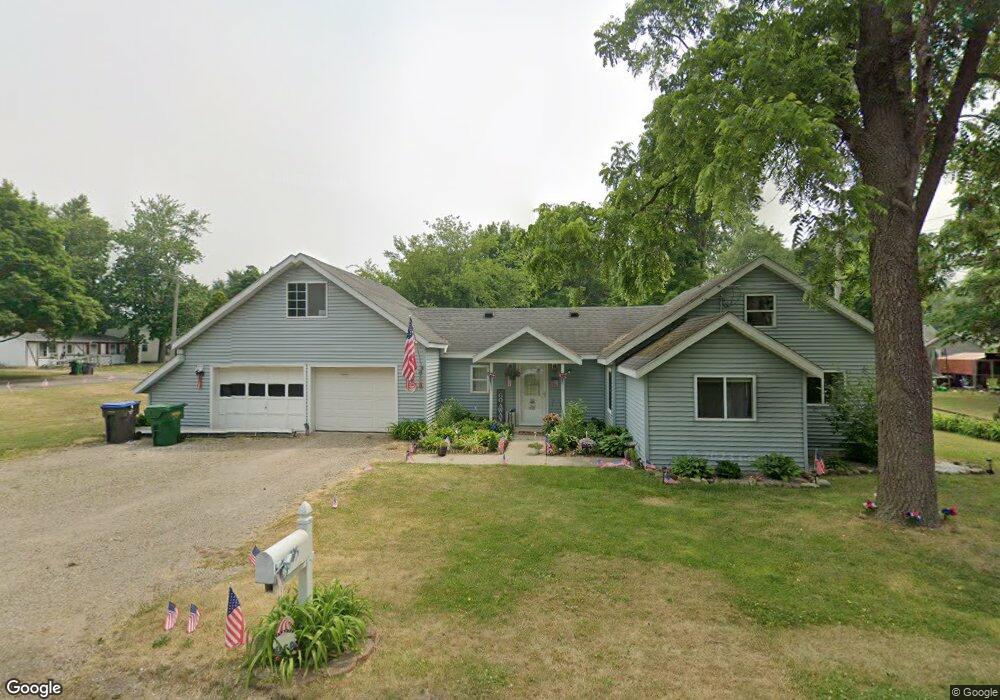
705 N Clay St Sturgis, MI 49091
Estimated Value: $100,000 - $164,000
Studio
--
Bath
1,070
Sq Ft
$122/Sq Ft
Est. Value
About This Home
This home is located at 705 N Clay St, Sturgis, MI 49091 and is currently estimated at $130,746, approximately $122 per square foot. 705 N Clay St is a home located in St. Joseph County with nearby schools including Sturgis High School and St John's Lutheran School.
Ownership History
Date
Name
Owned For
Owner Type
Purchase Details
Closed on
Jun 10, 2021
Sold by
Musselman Kevin
Bought by
Musselman Alexis R
Current Estimated Value
Home Financials for this Owner
Home Financials are based on the most recent Mortgage that was taken out on this home.
Original Mortgage
$31,350
Outstanding Balance
$23,803
Interest Rate
2.9%
Mortgage Type
New Conventional
Estimated Equity
$106,943
Purchase Details
Closed on
Aug 19, 2019
Sold by
Davis Sandra M
Bought by
Musselman Kevin
Purchase Details
Closed on
Jan 30, 2017
Sold by
Ewing Robert J
Bought by
Ewing Robert J and Lehman Quinn N
Purchase Details
Closed on
Oct 16, 2013
Sold by
Davis Sandra M
Bought by
Lehman Christine M and Ewing Robert J
Purchase Details
Closed on
Apr 11, 2013
Sold by
Livingstone April
Bought by
Oak Mortgage Llc
Purchase Details
Closed on
Jan 30, 2001
Sold by
Miller
Bought by
Livingstone
Purchase Details
Closed on
Jan 1, 1901
Create a Home Valuation Report for This Property
The Home Valuation Report is an in-depth analysis detailing your home's value as well as a comparison with similar homes in the area
Home Values in the Area
Average Home Value in this Area
Purchase History
| Date | Buyer | Sale Price | Title Company |
|---|---|---|---|
| Musselman Alexis R | $33,000 | Ata National Title Group Llc | |
| Musselman Kevin | -- | None Available | |
| Ewing Robert J | -- | None Available | |
| Lehman Christine M | -- | Patrick Abstract | |
| Oak Mortgage Llc | $40,372 | None Available | |
| Livingstone | $24,000 | -- | |
| -- | -- | -- |
Source: Public Records
Mortgage History
| Date | Status | Borrower | Loan Amount |
|---|---|---|---|
| Open | Musselman Alexis R | $31,350 |
Source: Public Records
Tax History
| Year | Tax Paid | Tax Assessment Tax Assessment Total Assessment is a certain percentage of the fair market value that is determined by local assessors to be the total taxable value of land and additions on the property. | Land | Improvement |
|---|---|---|---|---|
| 2025 | $1,419 | $58,800 | $6,500 | $52,300 |
| 2024 | $1,381 | $53,800 | $5,700 | $48,100 |
| 2023 | $1,339 | $46,500 | $5,700 | $40,800 |
| 2022 | $1,233 | $40,600 | $5,400 | $35,200 |
| 2021 | $2,066 | $35,900 | $5,300 | $30,600 |
| 2020 | $2,042 | $32,300 | $4,300 | $28,000 |
| 2019 | $1,172 | $28,800 | $5,100 | $23,700 |
| 2018 | $1,078 | $27,700 | $5,300 | $22,400 |
| 2017 | $1,055 | $28,400 | $28,400 | $0 |
| 2016 | -- | $21,900 | $21,900 | $0 |
| 2015 | -- | $19,100 | $0 | $0 |
| 2014 | -- | $17,100 | $17,100 | $0 |
| 2012 | -- | $15,900 | $15,900 | $0 |
Source: Public Records
Map
Nearby Homes
- 702 N Nottawa St
- 600 Saint Joseph St
- 703 W West St
- 501 N Fourth St
- 606 N Fourth St
- 502 N Prospect St
- 212 N Fourth St
- 507 N Prospect St
- 601 Neuman St
- 502 E Hatch St
- 410 W Chicago Rd
- 418 Center Ave
- 504 E Chicago Rd
- 105 Jean St
- 408 N Lakeview Ave
- 713 Wilshire Dr
- 212 Ilene St
- 210 S Monroe St
- 107 N Lakeview Ave
- 200 Michigan Ave
Your Personal Tour Guide
Ask me questions while you tour the home.