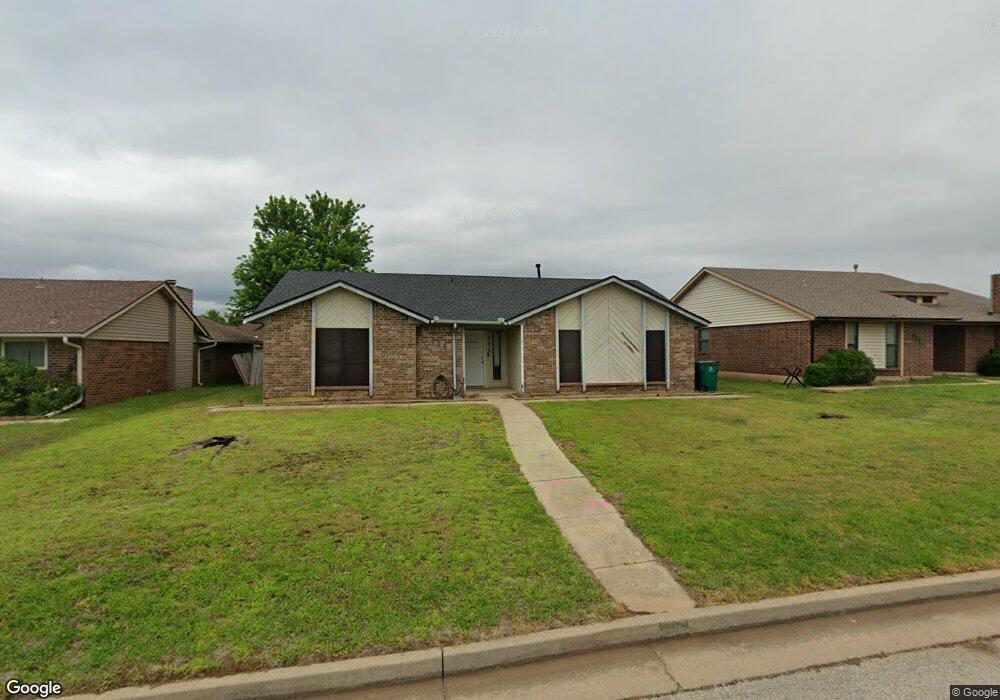
705 NW 141st St Edmond, OK 73013
Fair Hills NeighborhoodEstimated Value: $208,913 - $221,000
3
Beds
2
Baths
1,510
Sq Ft
$143/Sq Ft
Est. Value
About This Home
This home is located at 705 NW 141st St, Edmond, OK 73013 and is currently estimated at $215,228, approximately $142 per square foot. 705 NW 141st St is a home located in Oklahoma County with nearby schools including Charles Haskell Elementary School, Summit Middle School, and Santa Fe High School.
Ownership History
Date
Name
Owned For
Owner Type
Purchase Details
Closed on
Oct 3, 2013
Sold by
Schrupp Melissa Ann
Bought by
Schrupp Jonathan Fred
Current Estimated Value
Home Financials for this Owner
Home Financials are based on the most recent Mortgage that was taken out on this home.
Original Mortgage
$100,337
Outstanding Balance
$74,747
Interest Rate
4.28%
Mortgage Type
New Conventional
Estimated Equity
$140,482
Purchase Details
Closed on
Jan 19, 2013
Sold by
Schrupp Melissa Ann
Bought by
Schrupp Jonathan Fred
Purchase Details
Closed on
Mar 3, 2006
Sold by
Collins William F and Collins Sandra
Bought by
Schrupp Jonathan F and Schrupp Melissa A
Home Financials for this Owner
Home Financials are based on the most recent Mortgage that was taken out on this home.
Original Mortgage
$111,447
Interest Rate
6.19%
Mortgage Type
FHA
Create a Home Valuation Report for This Property
The Home Valuation Report is an in-depth analysis detailing your home's value as well as a comparison with similar homes in the area
Home Values in the Area
Average Home Value in this Area
Purchase History
| Date | Buyer | Sale Price | Title Company |
|---|---|---|---|
| Schrupp Jonathan Fred | -- | Stewart Abstract & Title | |
| Schrupp Jonathan Fred | -- | None Available | |
| Schrupp Jonathan F | $112,500 | None Available |
Source: Public Records
Mortgage History
| Date | Status | Borrower | Loan Amount |
|---|---|---|---|
| Open | Schrupp Jonathan Fred | $100,337 | |
| Previous Owner | Schrupp Jonathan F | $111,447 |
Source: Public Records
Tax History Compared to Growth
Tax History
| Year | Tax Paid | Tax Assessment Tax Assessment Total Assessment is a certain percentage of the fair market value that is determined by local assessors to be the total taxable value of land and additions on the property. | Land | Improvement |
|---|---|---|---|---|
| 2024 | $1,748 | $16,156 | $2,722 | $13,434 |
| 2023 | $1,748 | $15,685 | $2,814 | $12,871 |
| 2022 | $1,709 | $15,228 | $3,129 | $12,099 |
| 2021 | $1,639 | $14,785 | $3,027 | $11,758 |
| 2020 | $1,611 | $14,355 | $3,108 | $11,247 |
| 2019 | $1,576 | $13,992 | $3,006 | $10,986 |
| 2018 | $1,536 | $13,585 | $0 | $0 |
| 2017 | $1,562 | $13,878 | $2,657 | $11,221 |
| 2016 | $1,505 | $13,474 | $2,664 | $10,810 |
| 2015 | $1,491 | $13,289 | $2,664 | $10,625 |
| 2014 | $1,444 | $12,930 | $2,664 | $10,266 |
Source: Public Records
Map
Nearby Homes
- 701 NW 141st St
- 817 NW 141st St
- 500 NW 143rd St
- 521 NW 138th St
- 612 Glenridge Dr
- 816 NW 145th Cir
- 716 NW 137th St
- 704 NW 137th St
- 14509 Oakmond Rd
- 14705 Longford Way
- 1112 NW 140th Terrace
- 14809 Glenmark Dr
- 13804 Oakmond Rd
- 14045 Apache Dr
- 14812 Maplelake Dr
- 1256 NW 138th St
- 325 NW 146th St
- 508 NW 150th Place
- 125 NW 147th St
- 1416 NW 141st St
- 704 NW 142nd St
- 708 NW 142nd St
- 700 NW 142nd St
- 704 NW 141st St
- 712 NW 142nd St
- 708 NW 141st St
- 633 NW 141st St
- 700 NW 141st St
- 712 NW 141st St
- 716 NW 142nd St
- 632 NW 142nd St
- 721 NW 141st St
- 629 NW 141st St
- 716 NW 141st St
- 632 NW 141st St
- 720 NW 142nd St
- 628 NW 142nd St
- 725 NW 141st St
- 720 NW 141st St