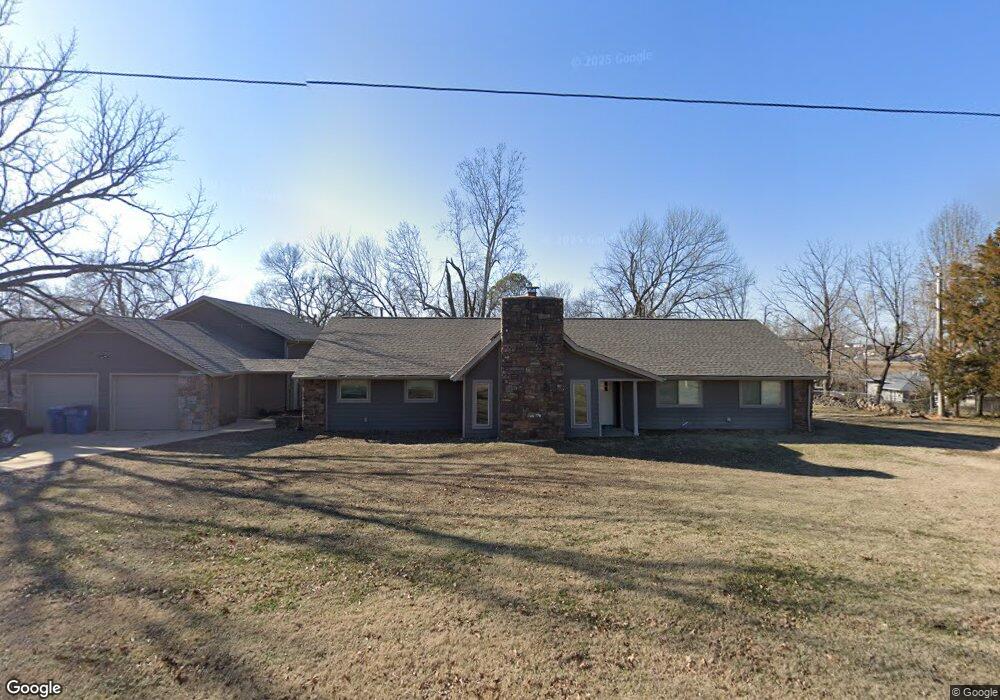
705 NW D St Bentonville, AR 72712
Estimated Value: $736,000 - $1,218,489
--
Bed
2
Baths
2,268
Sq Ft
$456/Sq Ft
Est. Value
About This Home
This home is located at 705 NW D St, Bentonville, AR 72712 and is currently estimated at $1,033,830, approximately $455 per square foot. 705 NW D St is a home located in Benton County with nearby schools including Sugar Creek Elementary School, Old High Middle School, and Lincoln Junior High School.
Ownership History
Date
Name
Owned For
Owner Type
Purchase Details
Closed on
Nov 21, 2012
Sold by
Seay Franklin M and Seay Donna R
Bought by
Neville Marissa D and Neville Grant E
Current Estimated Value
Home Financials for this Owner
Home Financials are based on the most recent Mortgage that was taken out on this home.
Original Mortgage
$120,000
Outstanding Balance
$83,040
Interest Rate
3.42%
Mortgage Type
New Conventional
Estimated Equity
$950,790
Purchase Details
Closed on
Mar 29, 1978
Bought by
Boon and Boon 45Ac
Purchase Details
Closed on
Sep 17, 1976
Bought by
Seay
Create a Home Valuation Report for This Property
The Home Valuation Report is an in-depth analysis detailing your home's value as well as a comparison with similar homes in the area
Home Values in the Area
Average Home Value in this Area
Purchase History
| Date | Buyer | Sale Price | Title Company |
|---|---|---|---|
| Neville Marissa D | $150,000 | Waco Title Company | |
| Boon | $2,000 | -- | |
| Seay | $10,000 | -- |
Source: Public Records
Mortgage History
| Date | Status | Borrower | Loan Amount |
|---|---|---|---|
| Open | Neville Marissa D | $120,000 |
Source: Public Records
Tax History Compared to Growth
Tax History
| Year | Tax Paid | Tax Assessment Tax Assessment Total Assessment is a certain percentage of the fair market value that is determined by local assessors to be the total taxable value of land and additions on the property. | Land | Improvement |
|---|---|---|---|---|
| 2025 | $3,904 | $205,772 | $94,982 | $110,790 |
| 2024 | $3,744 | $205,772 | $94,982 | $110,790 |
| 2023 | $3,566 | $57,700 | $9,400 | $48,300 |
| 2022 | $3,277 | $57,700 | $9,400 | $48,300 |
| 2021 | $3,265 | $57,700 | $9,400 | $48,300 |
| 2020 | $1,891 | $35,570 | $5,600 | $29,970 |
| 2019 | $1,891 | $35,570 | $5,600 | $29,970 |
| 2018 | $1,869 | $35,570 | $5,600 | $29,970 |
| 2017 | $1,616 | $35,570 | $5,600 | $29,970 |
| 2016 | $1,616 | $35,570 | $5,600 | $29,970 |
| 2015 | $1,831 | $29,630 | $5,400 | $24,230 |
| 2014 | $1,481 | $29,630 | $5,400 | $24,230 |
Source: Public Records
Map
Nearby Homes