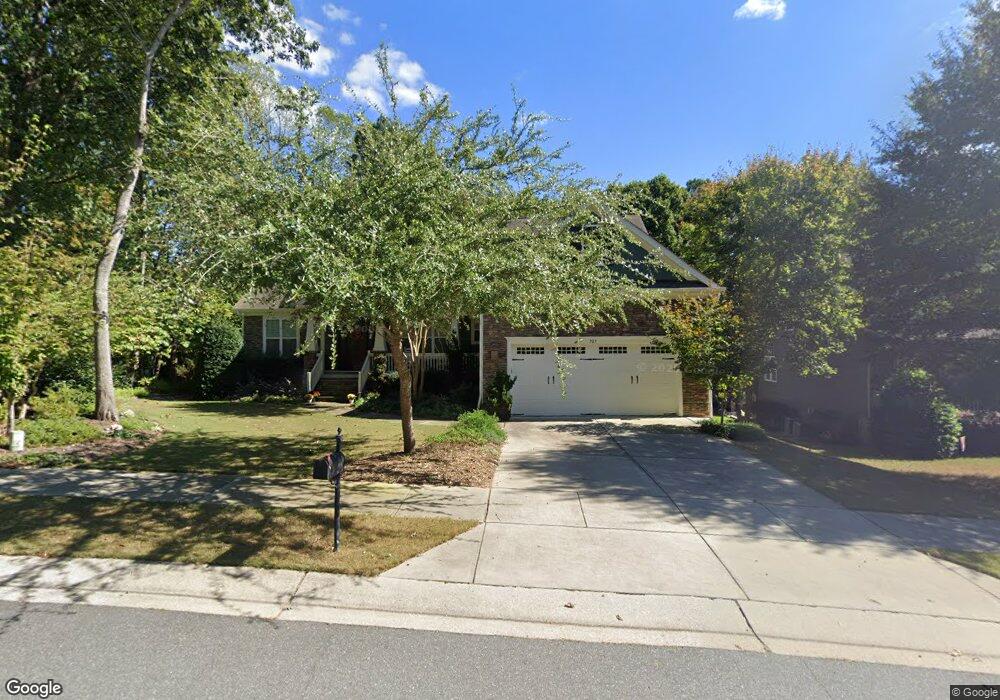
705 Opposition Way Wake Forest, NC 27587
Estimated Value: $484,000 - $744,000
5
Beds
3
Baths
3,247
Sq Ft
$198/Sq Ft
Est. Value
About This Home
This home is located at 705 Opposition Way, Wake Forest, NC 27587 and is currently estimated at $641,987, approximately $197 per square foot. 705 Opposition Way is a home located in Wake County with nearby schools including Richland Creek Elementary School, Wake Forest-Rolesville Middle School, and Wake Forest High School.
Ownership History
Date
Name
Owned For
Owner Type
Purchase Details
Closed on
Mar 7, 2024
Sold by
Dacus Stephen C and Dacus Sheila M
Bought by
Dacus Joint Living Trust and Dacus
Current Estimated Value
Purchase Details
Closed on
Jul 5, 2012
Sold by
Executive Custom Homes Inc
Bought by
Dacus Stephen C and Dacus Sheila M
Home Financials for this Owner
Home Financials are based on the most recent Mortgage that was taken out on this home.
Original Mortgage
$230,000
Interest Rate
3.05%
Mortgage Type
New Conventional
Purchase Details
Closed on
Jan 4, 2012
Sold by
Hj Morris Construction Oinc
Bought by
Executive Custom Homes Inc
Home Financials for this Owner
Home Financials are based on the most recent Mortgage that was taken out on this home.
Original Mortgage
$296,000
Interest Rate
3.99%
Mortgage Type
Future Advance Clause Open End Mortgage
Purchase Details
Closed on
Jun 26, 2007
Sold by
Contentnea Creek Development Co
Bought by
Hj Morris Construction Inc
Create a Home Valuation Report for This Property
The Home Valuation Report is an in-depth analysis detailing your home's value as well as a comparison with similar homes in the area
Home Values in the Area
Average Home Value in this Area
Purchase History
| Date | Buyer | Sale Price | Title Company |
|---|---|---|---|
| Dacus Joint Living Trust | -- | None Listed On Document | |
| Dacus Stephen C | $393,500 | None Available | |
| Executive Custom Homes Inc | $58,000 | None Available | |
| Hj Morris Construction Inc | $58,500 | None Available |
Source: Public Records
Mortgage History
| Date | Status | Borrower | Loan Amount |
|---|---|---|---|
| Previous Owner | Dacus Stephen C | $230,000 | |
| Previous Owner | Executive Custom Homes Inc | $296,000 |
Source: Public Records
Tax History Compared to Growth
Tax History
| Year | Tax Paid | Tax Assessment Tax Assessment Total Assessment is a certain percentage of the fair market value that is determined by local assessors to be the total taxable value of land and additions on the property. | Land | Improvement |
|---|---|---|---|---|
| 2025 | $5,562 | $578,463 | $130,000 | $448,463 |
| 2024 | $5,651 | $578,463 | $130,000 | $448,463 |
| 2023 | $4,729 | $405,278 | $82,000 | $323,278 |
| 2022 | $4,537 | $405,278 | $82,000 | $323,278 |
| 2021 | $4,458 | $405,278 | $82,000 | $323,278 |
| 2020 | $4,458 | $405,278 | $82,000 | $323,278 |
| 2019 | $4,942 | $396,730 | $70,000 | $326,730 |
| 2018 | $4,679 | $396,730 | $70,000 | $326,730 |
| 2017 | $4,523 | $396,730 | $70,000 | $326,730 |
| 2016 | $4,465 | $396,730 | $70,000 | $326,730 |
| 2015 | $4,442 | $389,740 | $58,000 | $331,740 |
| 2014 | -- | $389,740 | $58,000 | $331,740 |
Source: Public Records
Map
Nearby Homes
- 520 Checkmate Cir
- 1849 Grandmaster Way
- 1401 Endgame Ct
- 533 Opposition Way
- 1513 Trap Ct
- 1329 Endgame Ct
- 1829 Knights Crest Way
- 549 Kings Glen Way
- 1825 Armor Crest Ln
- 617 Dixon House Ct
- Ashford Plan at Radford Glen
- Newport Plan at Radford Glen
- Andrews Plan at Radford Glen
- Bedford Plan at Radford Glen
- Wayland Plan at Radford Glen
- Sheridan Plan at Radford Glen
- 501 Morning Glade St
- 1329 Martin Creek Dr
- 1609 Frog Hollow Way
- 1116 Sun Springs Rd
- 705 Opposition Way Unit 153
- 709 Opposition Way
- 709 Opposition Way Unit 152
- 701 Opposition Way Unit 154
- 701 Opposition Way
- 425 Gambit Cir
- 421 Gambit Cir
- 1604 Strategy Way
- 417 Gambit Cir
- 713 Opposition Way
- 700 Opposition Way
- 700 Opposition Way Unit 139
- 704 Opposition Way
- 413 Gambit Cir
- 429 Gambit Cir
- 708 Opposition Way
- 632 Opposition Way
- 717 Opposition Way
- 409 Gambit Cir
- 712 Opposition Way