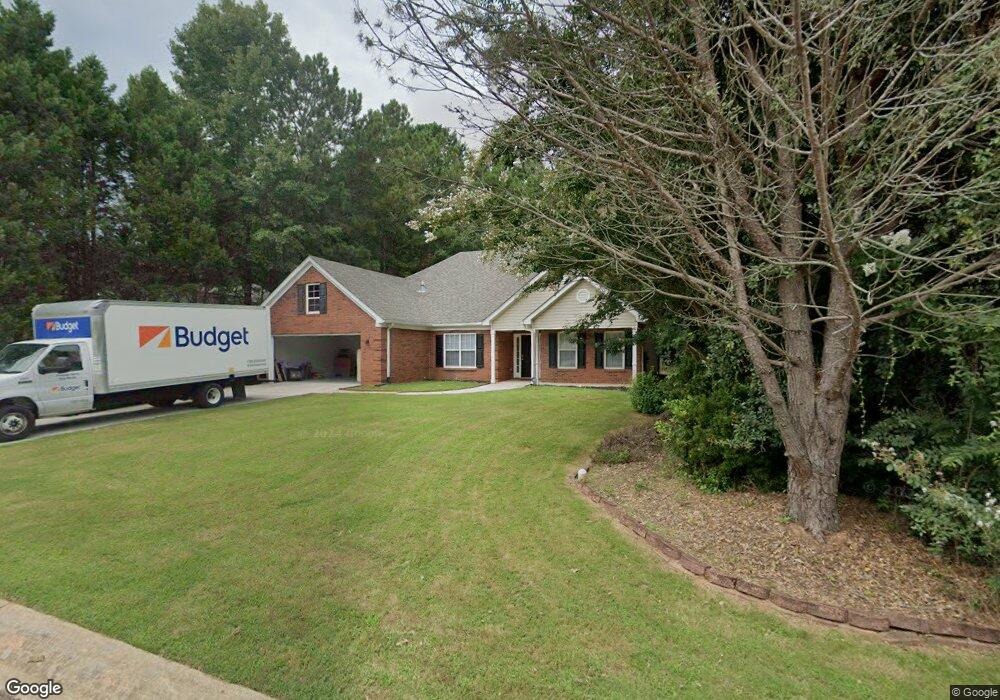
705 Pebble Blvd Unit 35 Covington, GA 30016
Estimated Value: $283,830 - $300,000
3
Beds
2
Baths
1,838
Sq Ft
$159/Sq Ft
Est. Value
About This Home
This home is located at 705 Pebble Blvd Unit 35, Covington, GA 30016 and is currently estimated at $292,958, approximately $159 per square foot. 705 Pebble Blvd Unit 35 is a home located in Newton County with nearby schools including West Newton Elementary School, Liberty Middle School, and Newton High School.
Ownership History
Date
Name
Owned For
Owner Type
Purchase Details
Closed on
Jun 15, 2022
Sold by
Offerpad Spe Borrower A Llc
Bought by
Mile High Borrower 1 Core Llc
Current Estimated Value
Purchase Details
Closed on
May 23, 2022
Sold by
Larkin Maurice
Bought by
Offerpad Spe Borrower A Llc
Purchase Details
Closed on
Jan 13, 2017
Sold by
Larkin Maurice
Bought by
Larkin Maurice and Larkin Jamila
Home Financials for this Owner
Home Financials are based on the most recent Mortgage that was taken out on this home.
Original Mortgage
$132,554
Interest Rate
4.5%
Mortgage Type
FHA
Purchase Details
Closed on
Jan 13, 2006
Sold by
Bordenkecher Laura B
Bought by
Smith Nita J
Home Financials for this Owner
Home Financials are based on the most recent Mortgage that was taken out on this home.
Original Mortgage
$29,700
Interest Rate
6.21%
Mortgage Type
Stand Alone Refi Refinance Of Original Loan
Purchase Details
Closed on
Aug 31, 2000
Sold by
Kali Const Inc
Bought by
Denard Martha S
Create a Home Valuation Report for This Property
The Home Valuation Report is an in-depth analysis detailing your home's value as well as a comparison with similar homes in the area
Home Values in the Area
Average Home Value in this Area
Purchase History
| Date | Buyer | Sale Price | Title Company |
|---|---|---|---|
| Mile High Borrower 1 Core Llc | $307,000 | -- | |
| Offerpad Spe Borrower A Llc | $310,000 | -- | |
| Larkin Maurice | -- | -- | |
| Larkin Maurice | $135,000 | -- | |
| Smith Nita J | $148,500 | -- | |
| Denard Martha S | $116,400 | -- |
Source: Public Records
Mortgage History
| Date | Status | Borrower | Loan Amount |
|---|---|---|---|
| Previous Owner | Larkin Maurice | $132,554 | |
| Previous Owner | Smith Nita J | $29,700 |
Source: Public Records
Tax History
| Year | Tax Paid | Tax Assessment Tax Assessment Total Assessment is a certain percentage of the fair market value that is determined by local assessors to be the total taxable value of land and additions on the property. | Land | Improvement |
|---|---|---|---|---|
| 2025 | $3,043 | $119,960 | $16,000 | $103,960 |
| 2024 | $2,864 | $110,800 | $16,000 | $94,800 |
| 2023 | $3,238 | $117,200 | $7,600 | $109,600 |
| 2022 | $2,139 | $76,720 | $7,600 | $69,120 |
| 2021 | $2,200 | $70,640 | $7,600 | $63,040 |
| 2020 | $2,112 | $61,200 | $7,600 | $53,600 |
| 2019 | $2,160 | $61,680 | $7,600 | $54,080 |
| 2018 | $1,890 | $53,400 | $7,600 | $45,800 |
| 2017 | $1,826 | $51,560 | $7,600 | $43,960 |
| 2016 | $1,627 | $45,760 | $4,000 | $41,760 |
| 2015 | $1,458 | $41,320 | $4,000 | $37,320 |
| 2014 | $1,257 | $35,600 | $0 | $0 |
Source: Public Records
Map
Nearby Homes
- 740 Pebble Blvd
- 385 Creekview Blvd
- 2093 Blackbird Cir
- 3789 Salem Rd
- 41 Woodland Rd
- 210 Mary Jane Ln
- 164 Mary Jane Ln
- 280 Mackenzie Ct
- 230 Mackenzie Ct
- 45 Somerset Ct
- 45 Sunset Ct
- 115 Buck Creek Dr
- 125 Buck Creek Dr
- 30 Vermillion Way
- 50 Amberjack Trail
- 160 Charleston Place
- 12462 Brown Bridge Rd
- 160 Wisteria Blvd
- 25 Buckeye Cir
- 40 Willow Tree Terrace
- 705 Pebble Blvd
- 705 Pebble Blvd
- 695 Pebble Blvd
- 715 Pebble Blvd
- 715 Pebble Blvd Unit 36
- 685 Pebble Blvd
- 725 Pebble Blvd
- 710 Pebble Blvd
- 690 Pebble Blvd
- 675 Pebble Blvd
- 735 Pebble Blvd
- 25 Pebble Brooke Ct
- 20 Pebble Brooke Ct Unit 1
- 720 Pebble Blvd
- 745 Pebble Blvd
- 665 Pebble Blvd
- 660 Pebble Blvd
- 35 Pebble Brooke Ct
- 30 Pebble Brooke Ct Unit 3
- 30 Pebble Brooke Ct
Your Personal Tour Guide
Ask me questions while you tour the home.