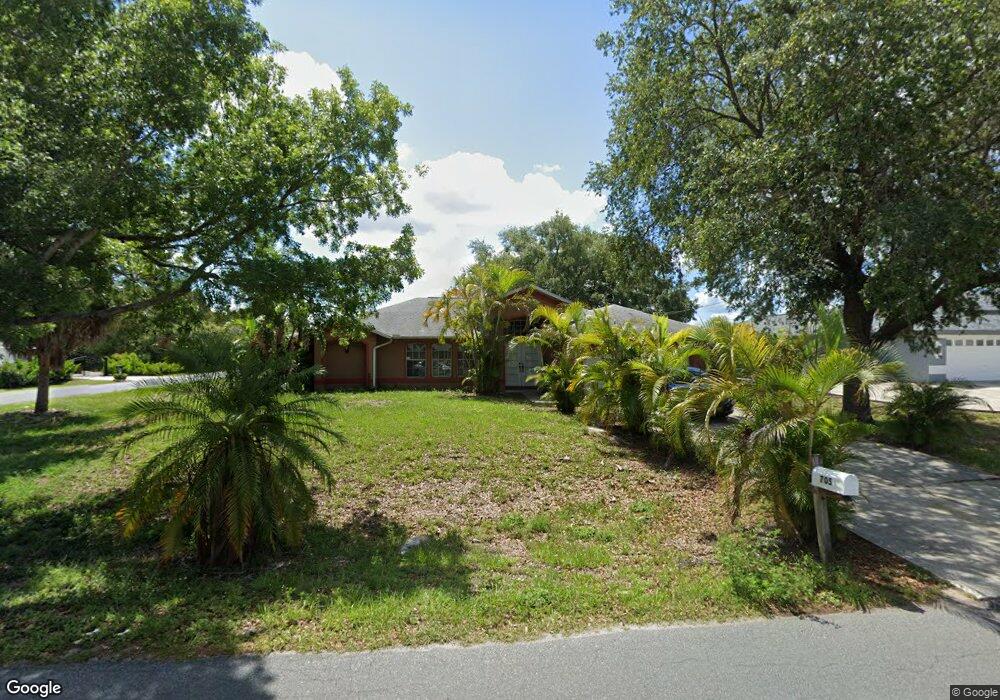
705 Rue Labeau Cir Fort Myers, FL 33913
Estimated Value: $290,549 - $350,000
3
Beds
2
Baths
1,991
Sq Ft
$157/Sq Ft
Est. Value
About This Home
This home is located at 705 Rue Labeau Cir, Fort Myers, FL 33913 and is currently estimated at $311,637, approximately $156 per square foot. 705 Rue Labeau Cir is a home located in Lee County with nearby schools including Lehigh Elementary School, Gateway Elementary School, and Tice Elementary School.
Ownership History
Date
Name
Owned For
Owner Type
Purchase Details
Closed on
Oct 18, 2013
Sold by
Starwood Investors Inc
Bought by
Sfo Properties Inc
Current Estimated Value
Purchase Details
Closed on
Feb 25, 2013
Sold by
Hyde Ylinda
Bought by
Starwood Investors Inc
Purchase Details
Closed on
Aug 25, 2004
Sold by
Mcmillin Euginna L
Bought by
Hyde Carl and Hyde Ylinda
Home Financials for this Owner
Home Financials are based on the most recent Mortgage that was taken out on this home.
Original Mortgage
$152,900
Interest Rate
6.5%
Mortgage Type
Unknown
Purchase Details
Closed on
Oct 30, 1998
Sold by
1St Home Bldr Of Fl
Bought by
Mcmillin Euginna L
Home Financials for this Owner
Home Financials are based on the most recent Mortgage that was taken out on this home.
Original Mortgage
$90,700
Interest Rate
6.65%
Create a Home Valuation Report for This Property
The Home Valuation Report is an in-depth analysis detailing your home's value as well as a comparison with similar homes in the area
Home Values in the Area
Average Home Value in this Area
Purchase History
| Date | Buyer | Sale Price | Title Company |
|---|---|---|---|
| Sfo Properties Inc | -- | None Available | |
| Starwood Investors Inc | $73,100 | None Available | |
| Hyde Carl | $169,900 | Team Title Insurance Inc | |
| Mcmillin Euginna L | $5,000 | -- |
Source: Public Records
Mortgage History
| Date | Status | Borrower | Loan Amount |
|---|---|---|---|
| Previous Owner | Hyde Carl | $152,900 | |
| Previous Owner | Mcmillin Euginna L | $90,700 |
Source: Public Records
Tax History Compared to Growth
Tax History
| Year | Tax Paid | Tax Assessment Tax Assessment Total Assessment is a certain percentage of the fair market value that is determined by local assessors to be the total taxable value of land and additions on the property. | Land | Improvement |
|---|---|---|---|---|
| 2025 | $3,952 | $249,283 | -- | -- |
| 2024 | $3,433 | $226,621 | -- | -- |
| 2023 | $3,805 | $206,019 | $0 | $0 |
| 2022 | $3,433 | $187,290 | $0 | $0 |
| 2021 | $3,024 | $170,264 | $15,398 | $154,866 |
| 2020 | $2,942 | $159,895 | $10,500 | $149,395 |
| 2019 | $2,845 | $152,608 | $7,500 | $145,108 |
| 2018 | $2,636 | $131,631 | $4,600 | $127,031 |
| 2017 | $2,635 | $133,242 | $3,815 | $129,427 |
| 2016 | $2,470 | $119,494 | $4,824 | $114,670 |
| 2015 | $2,296 | $105,296 | $4,195 | $101,101 |
| 2014 | $2,121 | $96,904 | $3,984 | $92,920 |
| 2013 | -- | $66,676 | $3,891 | $62,785 |
Source: Public Records
Map
Nearby Homes
- 718 Fargo Dr
- 13893 Golden Palms Cir
- 13172 Golden Palms Cir
- 141 Zenith Cir
- 13881 Golden Palms Cir
- 138 Zenith Cir
- 714 Zebu Place
- 818 Rue Labeau Cir
- 13268 Golden Palms Cir
- 763 Arundel Cir Unit 57
- 13125 Golden Palms Cir
- LOT 14 13686 Golden Palms Cir
- LOT 9 13718 Golden Palms Cir
- 13424 Golden Palms Cir
- 13364 Golden Palms Cir
- 717 Zendor Ave
- 13410 Golden Palms Cir
- 13779 Golden Palms Cir
- 813 Rue Labeau Cir
- 814 Rocaille Ave
- 707 Rue Labeau Cir
- 708 Altair Ave Unit 43
- 701 Arundel Cir
- 704 Rue Labeau Cir
- 709 Rue Labeau Cir
- 703 Arundel Cir
- 706 Rue Labeau Cir
- 710 Altair Ave
- 705 Arundel Cir
- 700 Fargo Dr
- 708 Rue Labeau Cir
- 711 Rue Labeau Cir
- 708 Arundel Cir
- 709 Fargo Dr
- 712 Altair Ave Unit 43
- 707 Arundel Cir
- 711 Fargo Dr
- 702 Fargo Dr
- 219 Aydin Ct