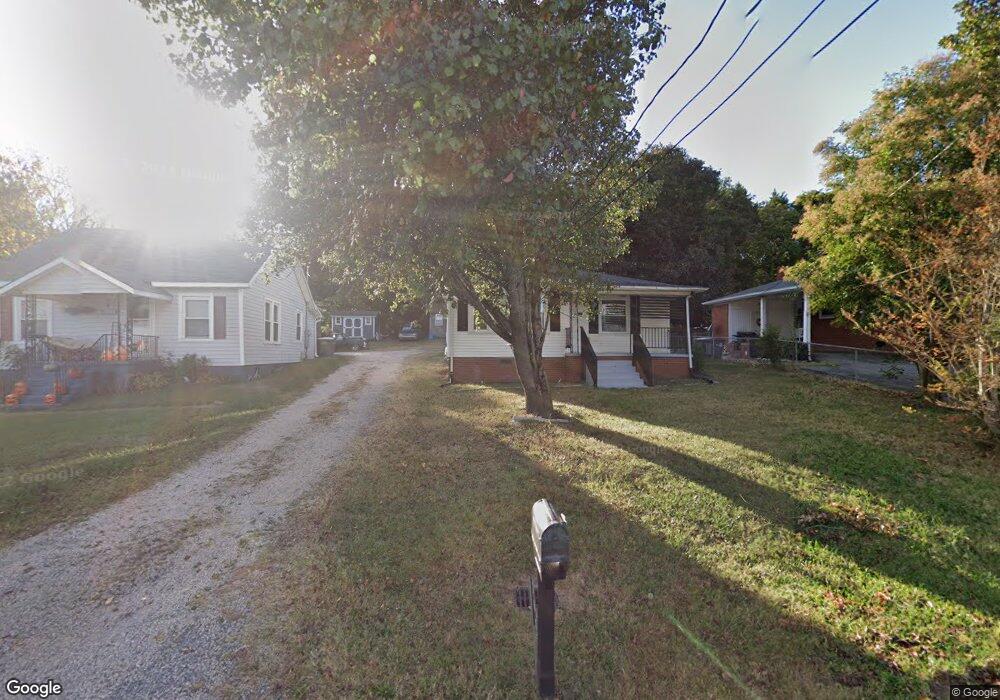
705 Ruth Ave Kannapolis, NC 28083
Estimated Value: $161,000 - $232,000
2
Beds
1
Bath
896
Sq Ft
$227/Sq Ft
Est. Value
About This Home
This home is located at 705 Ruth Ave, Kannapolis, NC 28083 and is currently estimated at $203,057, approximately $226 per square foot. 705 Ruth Ave is a home located in Cabarrus County with nearby schools including Jackson Park Elementary School, Kannapolis Middle, and A.L. Brown High School.
Ownership History
Date
Name
Owned For
Owner Type
Purchase Details
Closed on
Dec 15, 2006
Sold by
Brown Johnny Eric
Bought by
Chisholm Michael W
Current Estimated Value
Home Financials for this Owner
Home Financials are based on the most recent Mortgage that was taken out on this home.
Original Mortgage
$50,000
Interest Rate
6.01%
Mortgage Type
Purchase Money Mortgage
Purchase Details
Closed on
Jun 1, 2005
Sold by
Mtglq Investors Lp
Bought by
Brown Johnny Eric
Purchase Details
Closed on
May 27, 2005
Sold by
Key Bank Usa Na
Bought by
Mtglq Investors Lp
Purchase Details
Closed on
Jul 19, 2004
Sold by
Edgison Mary and Edgison Charles
Bought by
Key Bank Usa Na
Create a Home Valuation Report for This Property
The Home Valuation Report is an in-depth analysis detailing your home's value as well as a comparison with similar homes in the area
Home Values in the Area
Average Home Value in this Area
Purchase History
| Date | Buyer | Sale Price | Title Company |
|---|---|---|---|
| Chisholm Michael W | $62,500 | None Available | |
| Brown Johnny Eric | -- | -- | |
| Mtglq Investors Lp | -- | -- | |
| Key Bank Usa Na | $41,209 | -- |
Source: Public Records
Mortgage History
| Date | Status | Borrower | Loan Amount |
|---|---|---|---|
| Closed | Chisholm Michael W | $50,000 |
Source: Public Records
Tax History
| Year | Tax Paid | Tax Assessment Tax Assessment Total Assessment is a certain percentage of the fair market value that is determined by local assessors to be the total taxable value of land and additions on the property. | Land | Improvement |
|---|---|---|---|---|
| 2025 | $1,869 | $164,640 | $52,000 | $112,640 |
| 2024 | $1,869 | $164,640 | $52,000 | $112,640 |
| 2023 | $1,246 | $90,930 | $32,000 | $58,930 |
| 2022 | $1,246 | $90,930 | $32,000 | $58,930 |
| 2021 | $1,246 | $90,930 | $32,000 | $58,930 |
| 2020 | $1,246 | $90,930 | $32,000 | $58,930 |
| 2019 | $781 | $56,990 | $11,900 | $45,090 |
| 2018 | $769 | $56,990 | $11,900 | $45,090 |
| 2017 | $758 | $56,990 | $11,900 | $45,090 |
| 2016 | $758 | $64,540 | $15,300 | $49,240 |
| 2015 | $813 | $64,540 | $15,300 | $49,240 |
| 2014 | $813 | $64,540 | $15,300 | $49,240 |
Source: Public Records
Map
Nearby Homes
- 1409 Venus St
- 811 Mable Ave
- 904 Venus St
- 817 Mable Ave
- 1102 Lane St
- 704 Sloop Ave
- 415 Ruth Ave
- 1008 Mable Ave
- 1402 Brantley Rd
- 807 Carolyn Ave
- 406 Ruth Ave
- 704 Carolyn Ave
- 606 Jackson St
- 506 Nola Ave
- 1001 N Cannon Blvd
- 1003 N Cannon Blvd
- 346 Saint Joseph St
- 514 Jackson Park Rd
- 914 Carolyn Ave
- 1547 Tammy Ct
Your Personal Tour Guide
Ask me questions while you tour the home.