--
Bed
--
Bath
20,000
Sq Ft
0.59
Acres
About This Home
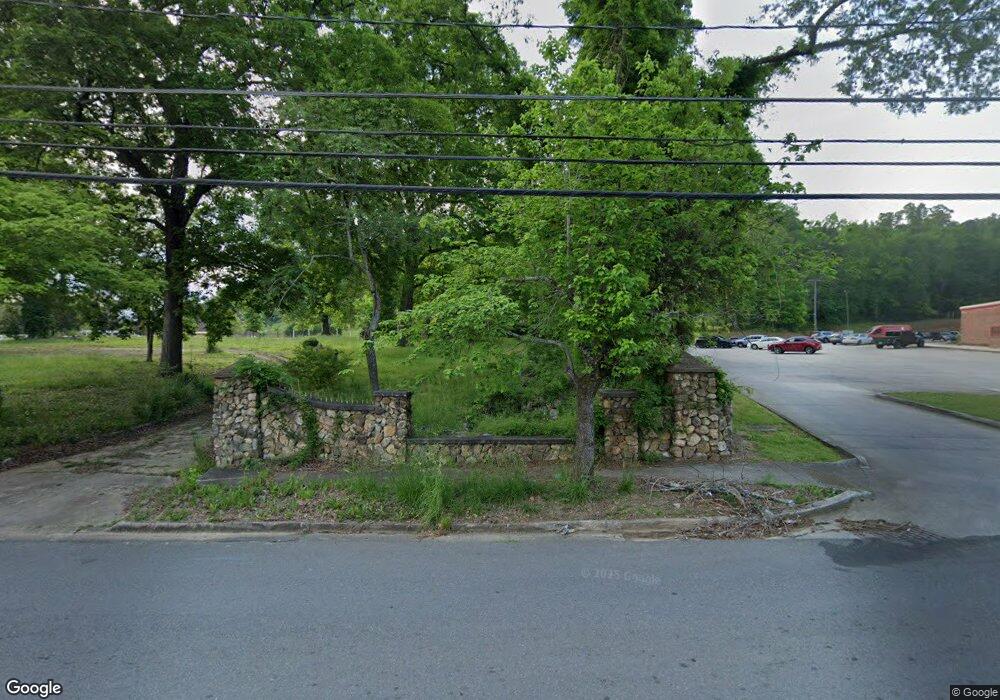
This home is located at 705 S Broad St SW, Rome, GA 30161. 705 S Broad St SW is a home located in Floyd County with nearby schools including Dan McCarty Middle School, Rome High School, and Darlington School.
Ownership History
Date
Name
Owned For
Owner Type
Purchase Details
Closed on
Dec 22, 2022
Sold by
809 Realty Llc
Bought by
Chalet Estates Ny Llc and Horizon Estates Ny Llc
Purchase Details
Closed on
Oct 1, 2017
Bought by
809 Realty Llc and C/O Venture Respiratory Inc
Purchase Details
Closed on
Aug 7, 2009
Sold by
Waddell Beverly M
Bought by
Sunbridge Healthcare Corp
Purchase Details
Closed on
Jun 1, 2009
Bought by
P and R
Purchase Details
Closed on
Mar 30, 2007
Sold by
Not Provided
Bought by
Sunbridge Healthcare Corp
Purchase Details
Closed on
Jan 31, 1980
Sold by
Mcglotha Ellamae Strickland
Bought by
Mcglotha Ella Mae
Purchase Details
Closed on
Sep 8, 1979
Bought by
P and R
Purchase Details
Closed on
Sep 7, 1979
Sold by
Mcglotha Jerelee and Ella Mae
Bought by
Mcglotha Ellamae Strickland
Purchase Details
Closed on
Mar 18, 1974
Sold by
Pine Log Land Co
Bought by
Mcglotha Jerelee and Ella Mae
Purchase Details
Closed on
Aug 1, 1973
Sold by
Berry Maebelle H
Bought by
Pine Log Land Co
Purchase Details
Closed on
Jan 1, 1901
Bought by
Berry Maebelle H
Create a Home Valuation Report for This Property
The Home Valuation Report is an in-depth analysis detailing your home's value as well as a comparison with similar homes in the area
Home Values in the Area
Average Home Value in this Area
Purchase History
| Date | Buyer | Sale Price | Title Company |
|---|---|---|---|
| Chalet Estates Ny Llc | -- | -- | |
| 809 Realty Llc | $4,510,392 | -- | |
| Sunbridge Healthcare Corp | $40,000 | -- | |
| P | -- | -- | |
| Sunbridge Healthcare Corp | -- | -- | |
| Mcglotha Ella Mae | -- | -- | |
| P | -- | -- | |
| Mcglotha Ellamae Strickland | -- | -- | |
| Mcglotha Jerelee | $17,000 | -- | |
| Pine Log Land Co | $8,000 | -- | |
| Berry Maebelle H | -- | -- |
Source: Public Records
Tax History Compared to Growth
Tax History
| Year | Tax Paid | Tax Assessment Tax Assessment Total Assessment is a certain percentage of the fair market value that is determined by local assessors to be the total taxable value of land and additions on the property. | Land | Improvement |
|---|---|---|---|---|
| 2024 | $839 | $21,961 | $7,989 | $13,972 |
| 2023 | $778 | $20,991 | $7,989 | $13,002 |
| 2022 | $745 | $20,413 | $7,263 | $13,150 |
| 2021 | $754 | $20,319 | $7,263 | $13,056 |
| 2020 | $766 | $20,464 | $7,263 | $13,201 |
| 2019 | $763 | $20,609 | $7,263 | $13,346 |
| 2018 | $768 | $20,754 | $7,263 | $13,491 |
| 2017 | $774 | $20,899 | $7,263 | $13,636 |
| 2016 | $784 | $21,100 | $7,240 | $13,860 |
| 2015 | $740 | $21,100 | $7,240 | $13,860 |
| 2014 | $740 | $21,100 | $7,240 | $13,860 |
Source: Public Records
Map
Nearby Homes
- 529 Branham Ave SW
- 3 Porter St SW
- 5 Jervis St SW
- 515 Hardy Ave SW
- 515 Harper Ave SW
- 13 N Blanche Ave SW
- 3 Grover St SW
- 111 Lookout Cir SW
- 113 Lookout Cir SW
- 107 Butler St SW
- 115 Lookout Cir SW
- 11 Blacks Bluff Rd SW
- 515 S Broad St SW
- 410 Hardy Ave SW
- 25 Blacks Bluff Rd SW
- 316 S McLin St SW
- 334 Branham Ave SW
- 110 Cherokee St SW
- 703 S Broad St SW
- 703 S Broad St
- 822 S Broad St SW
- 824 S Broad St SW
- 9 Pennington Ave SW
- 812 S Broad St SW
- 710 S Broad St
- 815 S Broad St SW
- 20 Wimpee St SW
- 107 W Glover St SW
- 808 S Broad St SW
- 18 Wimpee St SW
- 1 Pennington Ave SW
- 1 Pennington Ave SW
- 704 S Broad St SW
- 700 S Broad St SW
- 540 Branham Ave SW
- 16 Wimpee St SW
- 541 Branham Ave SW
- 814 S Broad St SW