Estimated Value: $154,000 - $333,000
2
Beds
1
Bath
788
Sq Ft
$309/Sq Ft
Est. Value
About This Home
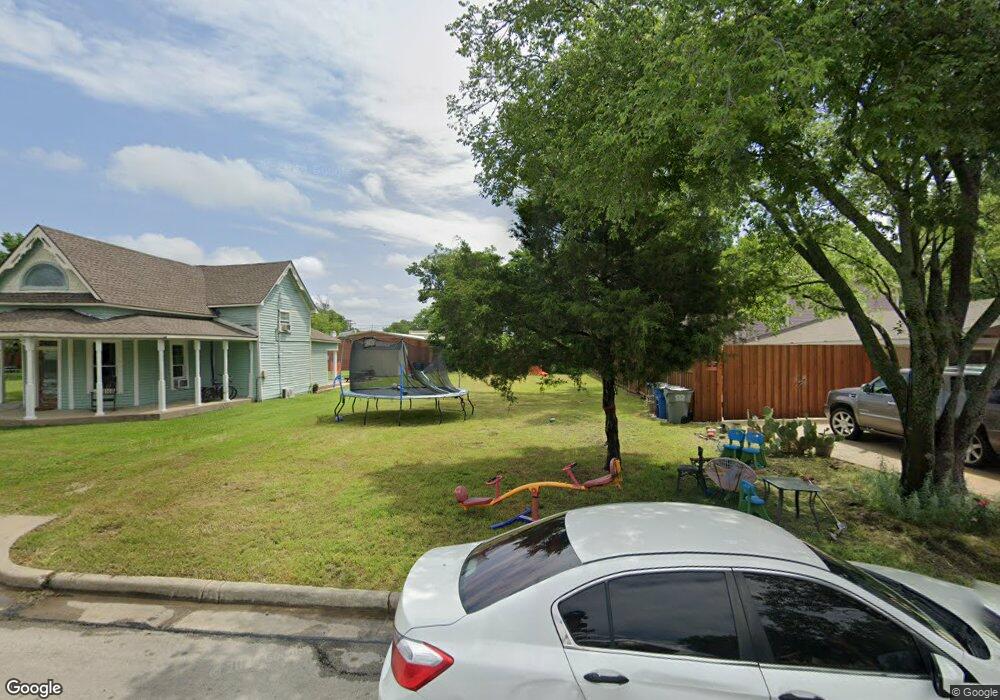
This home is located at 705 S Jackson Ave, Wylie, TX 75098 and is currently estimated at $243,500, approximately $309 per square foot. 705 S Jackson Ave is a home located in Collin County with nearby schools including R F Hartman Elementary School, AB Harrison Intermediate School, and Grady Burnett J High School.
Ownership History
Date
Name
Owned For
Owner Type
Purchase Details
Closed on
Nov 21, 2017
Sold by
Henandez Luciano
Bought by
Rodriguez Maria Bertha
Current Estimated Value
Purchase Details
Closed on
Jul 18, 2014
Sold by
Sun Land Reserve Of America Inc
Bought by
Hernandez Luciano
Purchase Details
Closed on
Jul 26, 2001
Sold by
Wallace Randall D and Wallace Audrey L
Bought by
Luevano Jose Francisco
Home Financials for this Owner
Home Financials are based on the most recent Mortgage that was taken out on this home.
Original Mortgage
$41,800
Interest Rate
7.05%
Purchase Details
Closed on
Jan 12, 2001
Sold by
Martindale Lavona Lee and Martindale Larry
Bought by
Wallace Randall D and Wallace Audrey L
Purchase Details
Closed on
Jul 7, 1998
Sold by
Campbell Jerry Monroe
Bought by
Martindale Lavona Lee
Create a Home Valuation Report for This Property
The Home Valuation Report is an in-depth analysis detailing your home's value as well as a comparison with similar homes in the area
Home Values in the Area
Average Home Value in this Area
Purchase History
| Date | Buyer | Sale Price | Title Company |
|---|---|---|---|
| Rodriguez Maria Bertha | -- | None Available | |
| Hernandez Luciano | -- | Ct | |
| Luevano Jose Francisco | -- | -- | |
| Wallace Randall D | -- | Commonwealth Land Title Co | |
| Martindale Lavona Lee | -- | -- |
Source: Public Records
Mortgage History
| Date | Status | Borrower | Loan Amount |
|---|---|---|---|
| Previous Owner | Luevano Jose Francisco | $41,800 |
Source: Public Records
Tax History Compared to Growth
Tax History
| Year | Tax Paid | Tax Assessment Tax Assessment Total Assessment is a certain percentage of the fair market value that is determined by local assessors to be the total taxable value of land and additions on the property. | Land | Improvement |
|---|---|---|---|---|
| 2025 | $1,086 | $66,000 | $70,000 | -- |
| 2024 | $1,086 | $55,000 | $55,000 | -- |
| 2023 | $1,086 | $55,000 | $55,000 | $0 |
| 2022 | $987 | $45,000 | $45,000 | $0 |
| 2021 | $1,059 | $45,000 | $45,000 | $0 |
| 2020 | $869 | $35,000 | $35,000 | $0 |
| 2019 | $920 | $35,000 | $35,000 | $0 |
| 2018 | $943 | $35,000 | $35,000 | $0 |
| 2017 | $1,208 | $44,856 | $30,000 | $14,856 |
| 2016 | $674 | $24,275 | $12,000 | $12,275 |
| 2015 | $673 | $26,340 | $12,000 | $14,340 |
Source: Public Records
Map
Nearby Homes
- 702 S Ballard Ave
- 416 S 1st St
- 329 S 2nd St
- 804 Memorial Dr
- 327 S 4th St
- 903 Mardi Gras Ln
- 307 Memorial Dr
- 300 S Cottonbelt Ave Unit 3A
- 301 S 3rd St
- 205 S Cottonbelt Ave
- 414 Briarwood Dr
- 406 Willow Way
- 401 Willow Way
- 217 Cloudcroft Dr
- 603 Valentine Ln
- 300 Woodhollow Ct
- 416 Dogwood Dr
- 1306 Angel Fire Dr
- 306 Woodhollow Ct
- 407 Stoneybrook Dr
- 703 S Jackson Ave
- 707 S Jackson Ave
- 709 S Jackson Ave
- 701 S Jackson Ave
- 711 S Jackson Ave
- 700 S Jackson Ave
- 700 S Ballard Ave
- 704 S Ballard Ave
- 607 S Jackson Ave
- 713 S Jackson Ave
- 710 S Jackson Ave
- 708 S Ballard Ave
- 213 Citizens Ave
- 710 S Ballard Ave
- 605 S Jackson Ave
- 202 Jackson Cir
- 203 Citizens Ave
- 604 S Jackson Ave
- 205 Citizens Ave
- 800 S Ballard Ave