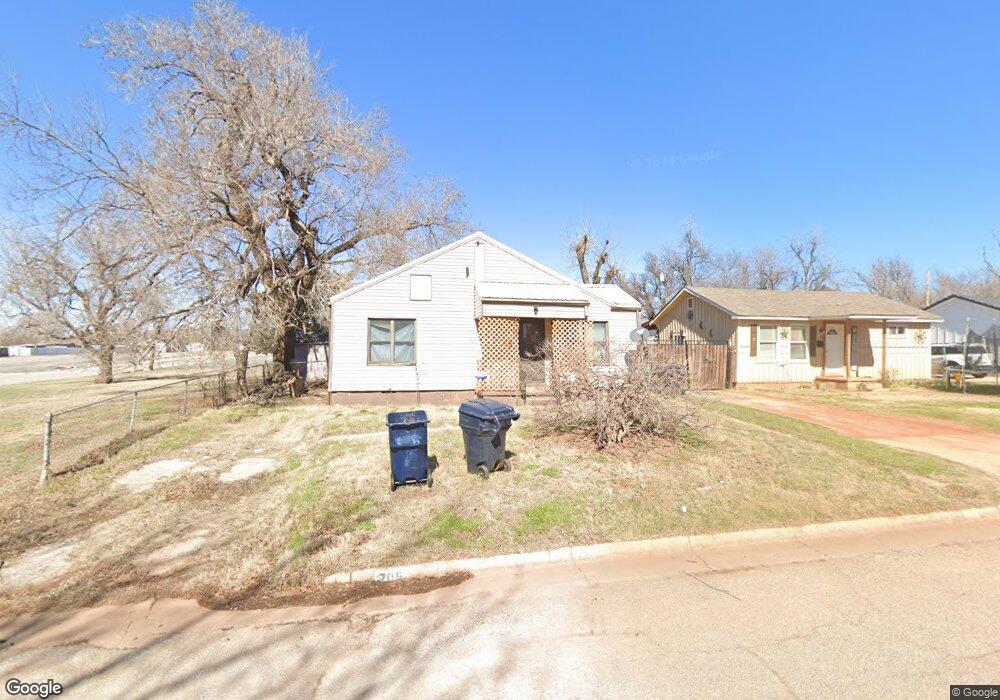
705 SE 34th St Oklahoma City, OK 73129
South Lindsay NeighborhoodEstimated Value: $113,108 - $170,000
3
Beds
1
Bath
1,053
Sq Ft
$131/Sq Ft
Est. Value
About This Home
This home is located at 705 SE 34th St, Oklahoma City, OK 73129 and is currently estimated at $138,027, approximately $131 per square foot. 705 SE 34th St is a home located in Oklahoma County with nearby schools including César Chávez Elementary School, Wheeler Middle School, and Capitol Hill High School.
Ownership History
Date
Name
Owned For
Owner Type
Purchase Details
Closed on
Oct 21, 2024
Sold by
Spark Brixton Llc
Bought by
Ibarra Elizabeth Vanessa and Ruiz Baltazar Sanchez
Current Estimated Value
Purchase Details
Closed on
Jun 17, 2024
Sold by
Duncan Bob L and Duncan Cathy D
Bought by
Spark Brixton Llc
Home Financials for this Owner
Home Financials are based on the most recent Mortgage that was taken out on this home.
Original Mortgage
$40,000
Interest Rate
7.22%
Mortgage Type
Construction
Purchase Details
Closed on
Jun 17, 1997
Sold by
Jaco Ritta P
Bought by
Duncan Bob L and Duncan Cathy D
Home Financials for this Owner
Home Financials are based on the most recent Mortgage that was taken out on this home.
Original Mortgage
$20,102
Interest Rate
7.93%
Create a Home Valuation Report for This Property
The Home Valuation Report is an in-depth analysis detailing your home's value as well as a comparison with similar homes in the area
Home Values in the Area
Average Home Value in this Area
Purchase History
| Date | Buyer | Sale Price | Title Company |
|---|---|---|---|
| Ibarra Elizabeth Vanessa | $145,000 | -- | |
| Spark Brixton Llc | $50,000 | Old Republic Title | |
| Duncan Bob L | $24,000 | -- |
Source: Public Records
Mortgage History
| Date | Status | Borrower | Loan Amount |
|---|---|---|---|
| Closed | Spark Brixton Llc | $40,000 | |
| Previous Owner | Duncan Bob L | $20,102 |
Source: Public Records
Tax History Compared to Growth
Tax History
| Year | Tax Paid | Tax Assessment Tax Assessment Total Assessment is a certain percentage of the fair market value that is determined by local assessors to be the total taxable value of land and additions on the property. | Land | Improvement |
|---|---|---|---|---|
| 2024 | $327 | $3,876 | $421 | $3,455 |
| 2023 | $327 | $3,764 | $475 | $3,289 |
| 2022 | $299 | $3,655 | $410 | $3,245 |
| 2021 | $286 | $3,548 | $479 | $3,069 |
| 2020 | $277 | $3,445 | $504 | $2,941 |
| 2019 | $265 | $3,345 | $467 | $2,878 |
| 2018 | $255 | $3,248 | $0 | $0 |
| 2017 | $244 | $3,153 | $846 | $2,307 |
| 2016 | $233 | $3,060 | $831 | $2,229 |
| 2015 | $225 | $2,972 | $933 | $2,039 |
| 2014 | -- | $2,886 | $579 | $2,307 |
Source: Public Records
Map
Nearby Homes
- 628 SW 35th St
- 3305 S Kelley Ave
- 810 SE Binkley St
- 745 SE 31st St
- 829 SE 32nd St
- 717 SE 31st St
- 628 SE 38th St
- 633 SE 39th St
- 430 SE Grand Blvd
- 1120 SE 39th St
- 1023 SE 39th St
- 1709 S Stiles Ave
- 604 SE 27th St
- 312 SE 40th St
- 916 SE 42nd St
- 2601 S Lindsay Ave
- 1307 SE 40th St
- 212 SE 41st St
- 3713 S Oklahoma Ave
- 116 SE 39th St